


I read a lot of bearish comments about commodities and gold, some even claiming it's a commodity bubble. Let's look at the charts (the facts):
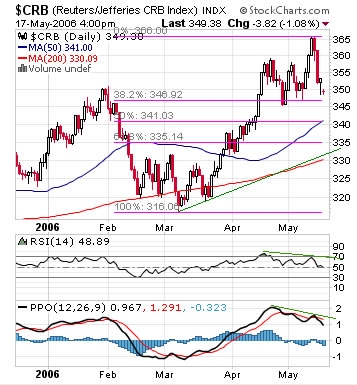
Short term (daily chart) the CRB commodity index is correcting a little bit:
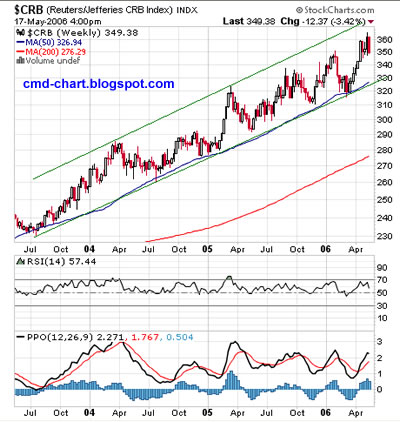
Long term (weekly chart), do you see the trend? , yes it's clearly up:
Deutsche Bank has done a good job with its DBC commodity ETF. Since the DBC IPO (February 2006) the DBC outperformed the CRB commodity index. DBC tracks the DBLCI index (Crude Oil, Heating Oil, Gold, Aluminum, Corn and Wheat)
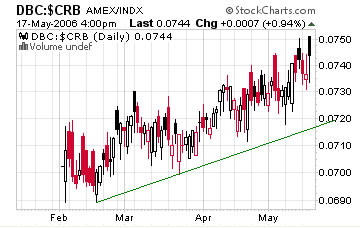
Investors who don’t trade futures contracts might use the DBC ETF to get direct exposure to commodity prices.
No comments:
Post a Comment