Commodities Charts Homp Page

Sunday, October 29, 2006

Platinum – Daily and Weekly charts

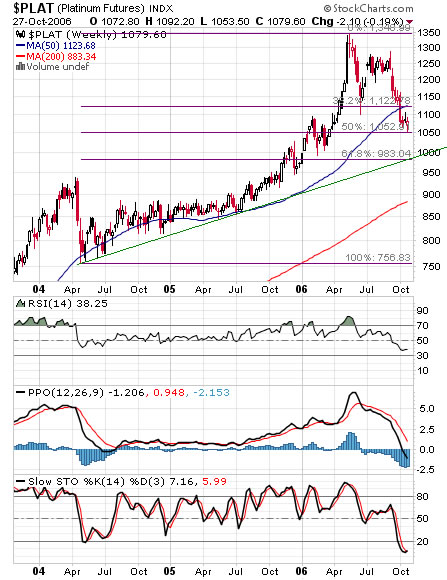
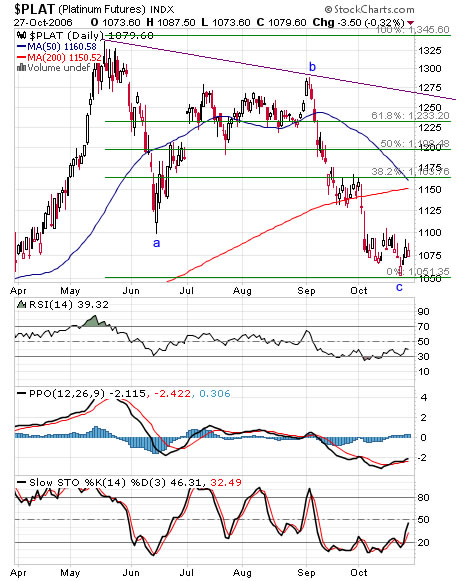
Platinum retraced 50% of the lengthy bullish wave which begun at mid 2004, the retracement took the shape of an ABC correction which is typical for correction waves. The indicators on the daily chart are slowly turning positive while the weekly charts need more time. Price is at major support, more support at the 983$ zone. Resistance at Fibonacci levels above current price.


Platinum weekly chart

Platinum daily chart

Saturday, October 21, 2006

Natural Gas – King of volatility

Natural Gas can easily claim the title – King of volatility among tradable commodities.

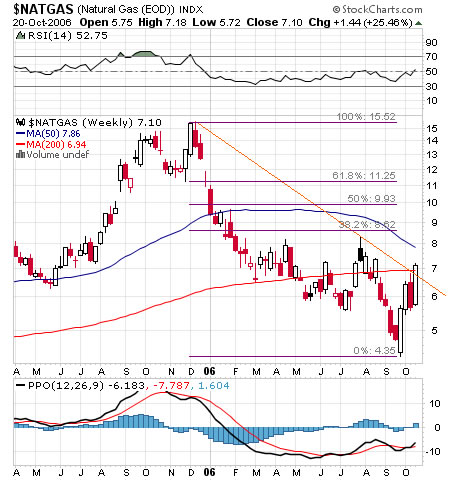
Technically, I think a major bottom is in place for natural gas. Diagonal downtrend line is broken to the upside. RSI is above 50 and the PPO looks slightly bullish.


Natural Gas weekly chart

CME and CBOT to Merge

CHICAGO, Oct. 17, 2006 – Chicago Mercantile Exchange Holdings Inc. (NYSE, NASDAQ: CME) and CBOT Holdings, Inc. (NYSE: BOT) today announced they have signed a definitive agreement to merge the two organizations to create the most extensive and diverse global derivatives exchange. The combined company, to be named CME Group Inc., a CME/Chicago Board of Trade Company, is expected to transform global derivatives markets, creating operational and cost efficiencies for customers and exchange members, while delivering significant benefits to shareholders. Corporate headquarters of the combined organization will remain in Chicago.-source

Search

Labels