Last year I posted several times about 81$ being a price target for profits taking.
See:
http://cmd-chart.blogspot.com/2006/04/crude-oil-futures-cl-chart-update.html
http://cmd-chart.blogspot.com/2006/04/new-all-time-high-for-crude-oil-wti.html
http://cmd-chart.blogspot.com/2006/05/crude-oil-futures-wti-elliott-wave.html
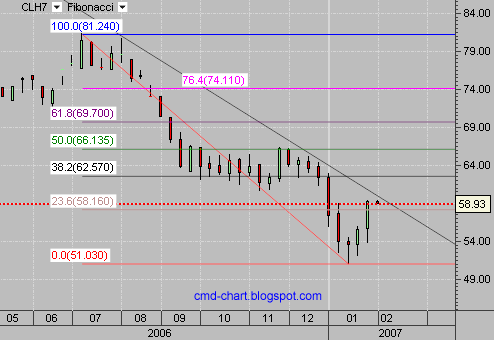
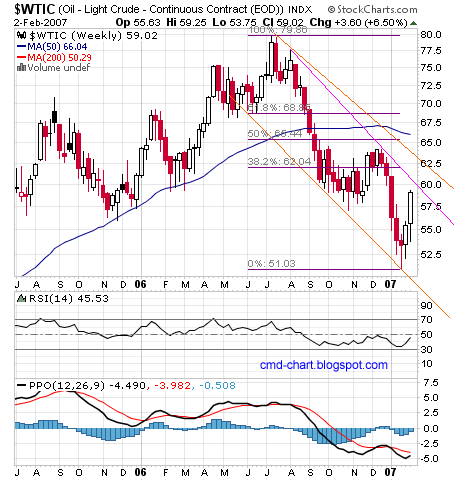
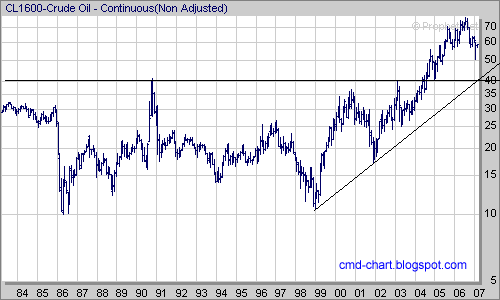
WTI Crude oil contracts topped at July 2006 and broke below the five years uptrend line. Crude bottomed at January 2007 and currently we are witnessing some upside but the downtrend channel is still intact. It is still early to determine if the January bottom is significant or not , using the long term chart as guidance I estimate that a down spike to about 40$ is possible. The 62.5$ - 66$ seems like significant resistance for the March contract. As I see the situation traders should be cautious and quick to take profits.


No comments:
Post a Comment