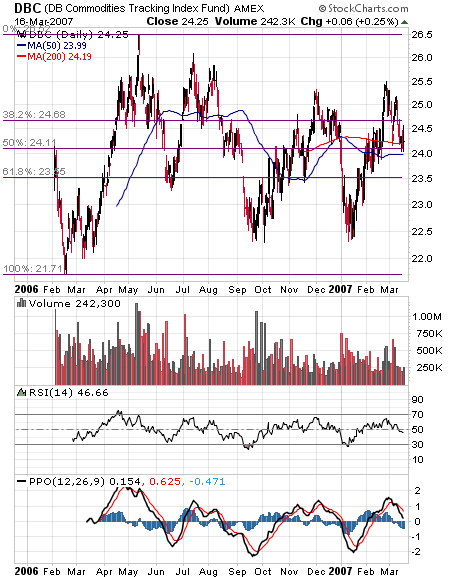
Anyone who bought the DBC at the IPO has seen little to no returns while at the same time nimble traders had several long & short trading opportunities.
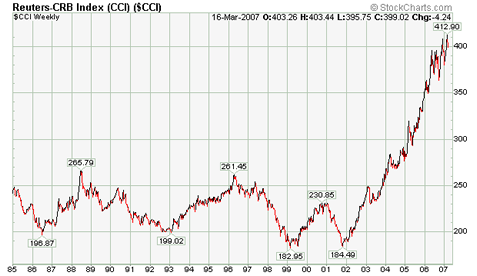
At the same time (February 2006 – March 2007) the CCI which is a broader commodity index have gained around 10%.
That’s made me thinking - Did Deutsche bank picked the wrong commodities?
Technically:
The DBC is near the 50 / 200 Moving averages and the 50% Fibonacci level. RSI is trending down below 50. The PPO is negative but still above the zero line.

CCI(NYBOT) long term chart


No comments:
Post a Comment