skip to main
|
skip to sidebar
Archive
►
2012
(1)
►
October
(1)
►
2008
(4)
►
December
(1)
►
June
(1)
►
March
(1)
►
January
(1)
►
2007
(20)
►
August
(1)
►
July
(3)
►
June
(2)
►
May
(1)
►
April
(7)
►
March
(3)
►
February
(2)
►
January
(1)
▼
2006
(100)
►
November
(2)
►
October
(3)
►
September
(1)
►
August
(2)
►
July
(7)
►
June
(11)
►
May
(17)
►
April
(14)
▼
March
(8)
Crude Oil chart ( NYMEX : CL )
Rhodium [Rh] hurdles $4,000/oz, highest since July...
Commodity ETF DBC (DB)
Palladium Futures , NYMEX : PA
Cocoa Futures (NYBOT : CC)
Heating Oil Futures (NYMEX : HO)
Propane Futures (NYMEX : PN)
Crude oil NYMEX chart
►
February
(15)
►
January
(20)
Gold Global Perspective
Gold & Silver Stocks
Contact @
Wednesday, March 29, 2006
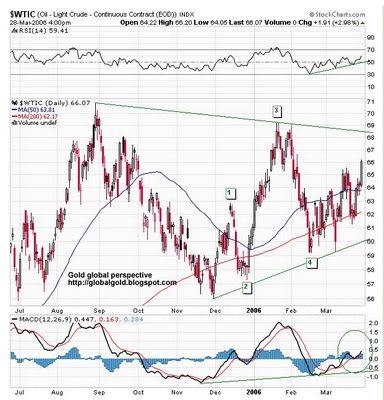
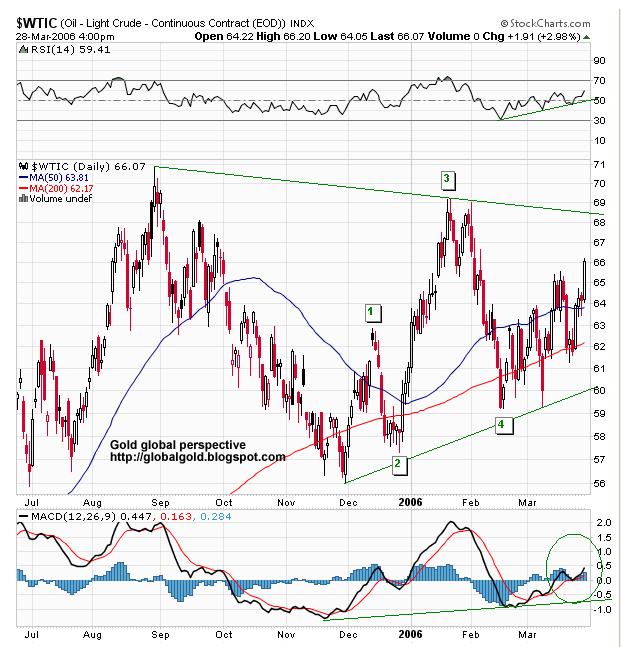
Crude Oil chart ( NYMEX : CL )
Still trading below Aug 2005 all time high, possibly constructing a symmetrical triangle pattern , RSI , MACD are trending up on the daily chart.
Previous review of Crude Oil
Gold and Silver charts, news, reviews & commentary
No comments:
Post a Comment
Newer Post
Older Post
Home
Subscribe to:
Post Comments (Atom)
Search
Labels
Aluminum
(6)
CBOT
(6)
CCI
(6)
China
(2)
CME
(5)
Cocoa
(1)
Coffee
(1)
COMEX
(5)
Commodity ETF
(14)
Copper
(14)
Corn
(1)
Cotton
(1)
CRB
(10)
Crude Oil
(22)
DBC
(5)
DBLCI
(2)
Elliott Wave
(18)
Frozen Pork Bellies
(1)
GFMS
(1)
Global Demand
(1)
Gold
(1)
Goldman Sachs
(1)
GSCI
(1)
Heating Oil
(1)
India
(2)
Iran
(1)
Iridium
(1)
Jim Rogers
(1)
LBCI
(1)
Lead
(1)
Lehman Brothers
(1)
Live Cattle
(1)
LME
(4)
Lumber
(1)
Marc Faber
(1)
Margins
(1)
MCX
(1)
Mines
(4)
Mining Laws
(3)
Molybdenum
(1)
Mongolia
(1)
Natural Gas
(5)
Nickel
(3)
NYBOT
(8)
NYMEX
(13)
Oats
(1)
Orange Juice
(1)
Palladium
(11)
Penny
(1)
Platinum
(12)
Propane
(1)
Rhodium
(3)
Rice
(2)
RICI
(1)
Russia
(2)
Ruthenium
(1)
Silver
(3)
Soybeans
(1)
Stephen Roach
(1)
Sugar
(1)
Tanzania
(1)
Tin
(1)
TOCOM
(2)
TRAKERS
(1)
Unleaded Gas
(2)
Uranium
(1)
USO
(4)
Venezuela
(1)
Video
(1)
Wheat
(1)
World Bank
(1)
Xetra
(1)
Zinc
(3)
Commodities Charts
 Previous review of Crude OilGold and Silver charts, news, reviews & commentary


No comments:
Post a Comment