


Platinum miners have warned that new proposals to introduce an exchange-traded fund (ETF) would put further pressure on the precious metal's production.
The world's largest miners of platinum have pointed out that the platinum market is currently close to tipping point, with demand close to supply.
But plans for an ETF could push demand way ahead of production levels, because such a fund requires an equal amount of metal stored in a vault for every ounce of ETF platinum bought.
Sandy Wood, commercial director of Anglo Platinum, said that this would put even more pressure on producers in an already tight market.
This view was confirmed by Impala Platinum's marketing director, Derek Engelbrecht, who told Business Report: "We would probably be against an ETF."
Other top platinum miners have also opposed the plans, despite the fact that ETFs are used in both the gold and silver markets. -source

Wednesday, November 15, 2006
Wednesday, November 08, 2006
31 Exchange Traded Commodities on Deutsche Börse's
On Friday, ETF Securities listed 31 ETCs on Deutsche Börse's Xetra platform, comprising 21 individual securities and 10 index securities.
The 21 separate classes of commodity securities available are:
Aluminium, Brent Oil, Coffee, Copper, Corn, Cotton, Crude Oil, Gasoline, Gold, Heating Oil, Lean Hogs, Live Cattle, Natural Gas, Nickel, Silver, Soybean Oil, Soybeans, Sugar, Wheat, WTI Oil & Zinc.
The 10 baskets of commodities are:
All Commodities, Agriculture, Energy, Ex-Energy, Grains, Industrial Metals, Livestock
Petroleum, Precious Metals, Softs.
source
Sunday, October 29, 2006
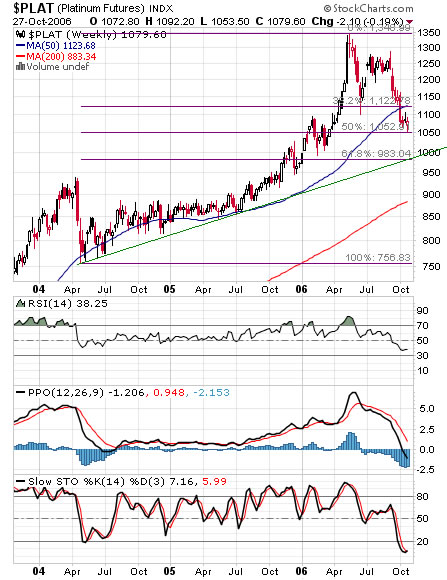
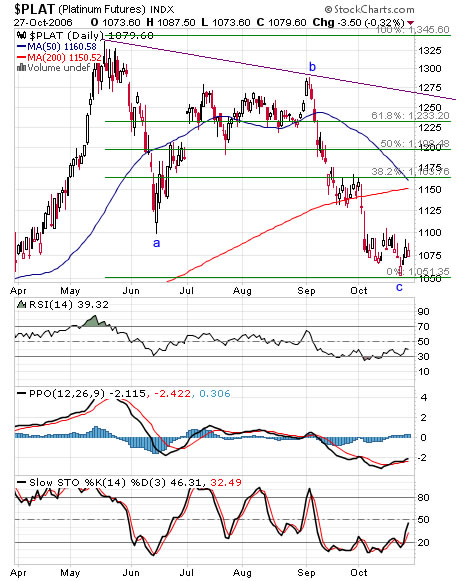
Platinum – Daily and Weekly charts
Platinum retraced 50% of the lengthy bullish wave which begun at mid 2004, the retracement took the shape of an ABC correction which is typical for correction waves. The indicators on the daily chart are slowly turning positive while the weekly charts need more time. Price is at major support, more support at the 983$ zone. Resistance at Fibonacci levels above current price.
Saturday, October 21, 2006
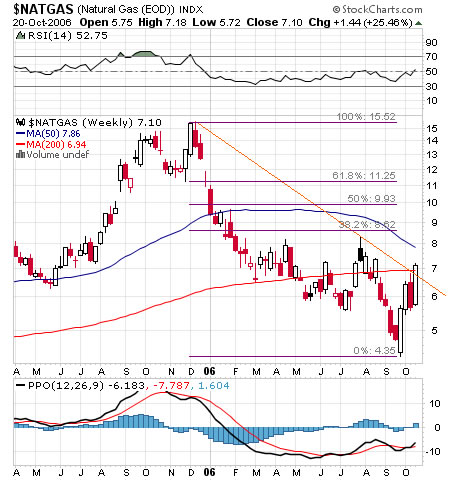
Natural Gas – King of volatility
Natural Gas can easily claim the title – King of volatility among tradable commodities.
Technically, I think a major bottom is in place for natural gas. Diagonal downtrend line is broken to the upside. RSI is above 50 and the PPO looks slightly bullish.
Technically, I think a major bottom is in place for natural gas. Diagonal downtrend line is broken to the upside. RSI is above 50 and the PPO looks slightly bullish.
CME and CBOT to Merge
CHICAGO, Oct. 17, 2006 – Chicago Mercantile Exchange Holdings Inc. (NYSE, NASDAQ: CME) and CBOT Holdings, Inc. (NYSE: BOT) today announced they have signed a definitive agreement to merge the two organizations to create the most extensive and diverse global derivatives exchange. The combined company, to be named CME Group Inc., a CME/Chicago Board of Trade Company, is expected to transform global derivatives markets, creating operational and cost efficiencies for customers and exchange members, while delivering significant benefits to shareholders. Corporate headquarters of the combined organization will remain in Chicago.-source
Saturday, September 16, 2006
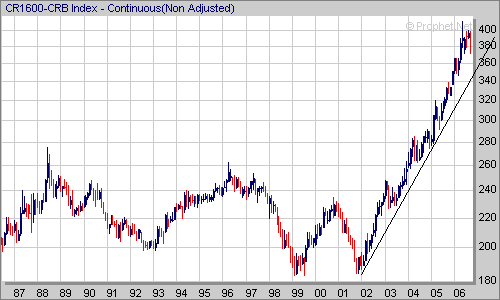
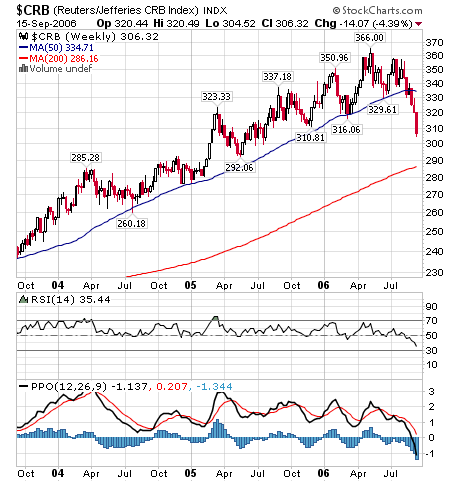
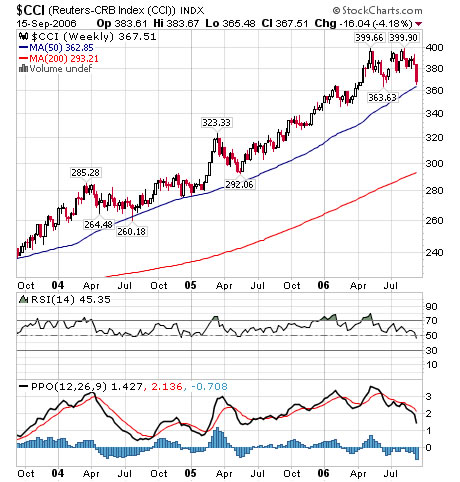
CRB, CCI COMMODITY INDEX
CRB/ CCI are under serious correction since around when the US FED paused the IR hikes. The FED policy seems be pretty successful – price stabilization while equity markets did not suffer much pain.
There is an interesting divergence between the CRB and CCI. Long term monthly CCI chart still look pretty good, short term the CRB has been sliding much lower then CCI.
More Info regarding CRB indexes could be found at CRBTrader.com and The New York Board of Trade NYBOT.
There is an interesting divergence between the CRB and CCI. Long term monthly CCI chart still look pretty good, short term the CRB has been sliding much lower then CCI.
More Info regarding CRB indexes could be found at CRBTrader.com and The New York Board of Trade NYBOT.
Tuesday, August 22, 2006
Saturday, August 05, 2006
Coffee Futures (NYBOT : C) - Elliott Wave Count
Coffee futures and options are trading at the New York Board of Trade (NYBOT). Coffee is one of the components of the CRB INDEX.
The price is quoted at cents per pound; contract size is 37,500 pounds for the full size contract (CK) and 12,500 pounds for the mini size contract (MK).
From the long term chart below we can learn that since the first half of 1977 till the second half of 2001 coffee was in a severe bear market and lost about 85% of its price.
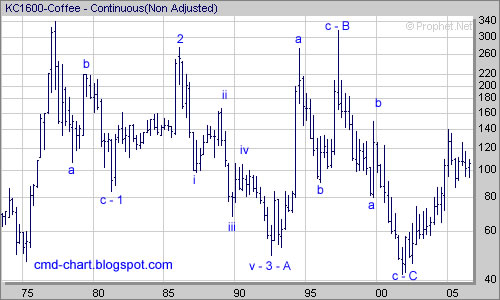
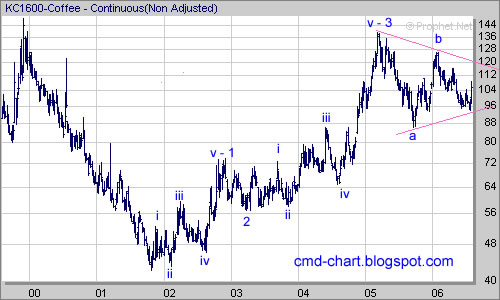
Since 2001 Coffee (like so many other commodities)is going up consistently with occasional pullbacks. I think that the 2001 bottom in the price of coffee is significant and technically coffee is positioned for a long bull market.
Short term coffee consolidates and forming a symmetrical triangle pattern, a break out one way or another should soon follow. If coffee can break above the (b) high that will indicate that the short term correction is over while a break down below the (a) low will indicate that some more consolidation is required before the continuation of the long term bull market.
The price is quoted at cents per pound; contract size is 37,500 pounds for the full size contract (CK) and 12,500 pounds for the mini size contract (MK).
From the long term chart below we can learn that since the first half of 1977 till the second half of 2001 coffee was in a severe bear market and lost about 85% of its price.
Since 2001 Coffee (like so many other commodities)is going up consistently with occasional pullbacks. I think that the 2001 bottom in the price of coffee is significant and technically coffee is positioned for a long bull market.
Short term coffee consolidates and forming a symmetrical triangle pattern, a break out one way or another should soon follow. If coffee can break above the (b) high that will indicate that the short term correction is over while a break down below the (a) low will indicate that some more consolidation is required before the continuation of the long term bull market.
Thursday, July 20, 2006
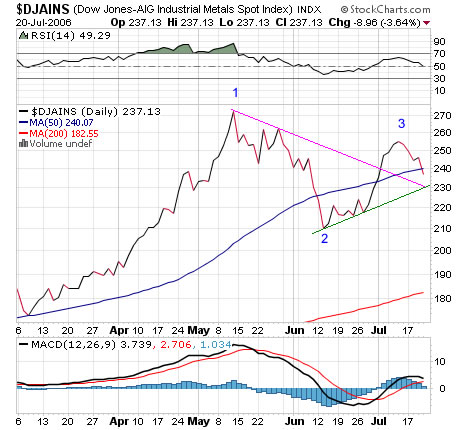
Dow Jones-AIG Industrial Metals Index
Dow Jones-AIG Industrial Metals Index includes: Aluminum, Copper, Zinc and Nickel.
The Indexed topped at mid 2006 ( top labeled 1) and lost 60 points or about 23% by mid June a bottom (labeled 2) was made and the index climbed higher to recoup most of decline.
Currently the index is trading just below the 50 daily moving average (DMA), RSI trending down, PPO still positive but seems to be ready to turn back down. Short term support at 230 - where the green and pink lines cross each other. Failure to hold the 230 level will indicate that the correction is not over and lower low (lower then 2) will follow. A successful retest of the 230 level will indicate the correction is over and higher highs should be expected.
Tuesday, July 11, 2006
Mongolia mining laws may delay Ivanhoe
Again, not unjustified in my opinion.
WENDY STUECK MINING REPORTER
VANCOUVER -- New mining laws in Mongolia give the country the right to bargain for up to a 34-per-cent stake in "strategic" mineral deposits, creating more uncertainty for foreign resource investors and raising the potential for further delays for Ivanhoe Mines Ltd.'s flagship Oyu Tolgoi project.
"The reality is that the [Mongolian] government is clearly controlling the agenda of this project," said Raymond James analyst Tom Meyer.
"I think Ivanhoe shareholders should expect further delays, not on the order of months -- which I think is the view that's out there -- but realistically, we could be looking at years."
Vancouver-based Ivanhoe is developing the Oyu Tolgoi project, a big copper-gold deposit about 80 kilometres from the border between China and Mongolia.
The company has spent more than two years trying to strike a stability agreement with the Mongolian government for Oyu Tolgoi to cover issues such as taxes and royalties for the proposed mine, which is expected to cost more than $1-billion to put into production.
In a statement yesterday, Vancouver-based Ivanhoe said Mongolia's revised minerals law, and previous amendments to the country's tax law, "have set the stage for finalization of negotiations on a formal, long-term agreement with Ivanhoe."
"We now have a broad playing field with flexibility to tailor an agreement appropriate for the Oyu Tolgoi project," Ivanhoe chief executive officer John Macken said in a statement.
"We are confident that Ivanhoe and the government of Mongolia can proceed to reach a mutually beneficial accord that will establish a precedent for future capital-intensive projects backed by investors from around the world who are closely monitoring these developments."
The Mongolian Parliament approved a revised minerals law on Saturday. Under the revised law, "stability agreements" are to be replaced by investment contracts. New provisions double the term of such agreements from 15 to 30 years for projects expected to cost more than $300-million.
The revised law gives the Mongolian government the right to acquire an interest of up to 34 per cent of strategic deposits discovered through privately-financed exploration, and up to 50 per cent of deposits discovered through the use of state funds during the Soviet era.
The definition of a strategic deposit is broad, but includes deposits that could generate annual mineral production equivalent to more than 5 per cent of Mongolia's gross domestic product, a threshold that would be easily passed by Oyu Tolgoi if it were in production.
Previously, talk of Mongolian government participation in mining projects had focused on those projects that had been discovered with the use of state funds.
It's unclear how such an investment could affect Oyu Tolgoi: the law states that any acquisition of a state interest is subject to negotiation and would also depend on how much money the government would invest.
But the uncertainty around the new provisions, as well as a recently-passed windfall tax, are giving pause to foreign investors and shifting attention to projects in jurisdictions perceived to have more favourable political climates, Mr. Meyer said. -source
Related : Special risks when investing in a mining company
Tanzania starts talks on mining law
I expect that this trend will continue. Investors and International companies must understand that natural resources are major income source for many developing nations.
Tanzania has started preliminary talks with mining companies on renegotiating mining laws to give greater benefits to the country, President Jakaya Kikwete said on Tuesday.
Under existing mining laws, Tanzania's government earns 3% royalty fees from its minerals and imposes a 30% corporate tax that kicks in only after 100% depreciation of a company's capital investment in the country.
"That's where the problem is. Some mines are closing down after years of operating but before Tanzania can accrue any gains and we wonder whether they have made losses all along. So, we need to renegotiate this aspect," Kikwete told Reuters in South Africa on the sidelines of a technology conference.
"Talks on this question started yesterday (Monday). We are not trying to intimidate anyone. The companies appear to understand our position. We want a win-win situation, where the Tanzanian people can gain from their natural resources."
Mining is at the heart of Tanzania's efforts to boost growth. Tanzania's economy expanded by around 6,9% in 2005 but that rate is forecast to decline to 5,8% on spiralling fuel costs and drought.
Top gold miner AngloGold Ashanti, dominant diamond company De Beers, both part-owned by diversified miner Anglo American Plc, as well as RandGold are some of the key players in Tanzania's mining industry.
The companies were not immediately available to comment.
Kikwete said he had not set a deadline for any changes to the tax structure and Tanzania would negotiate in good faith.
In a wide-ranging interview, Kikwete also said that the government had intensified its fight against HIV and AIDS, and was using its own cash and funding from the US government and private initiatives to cut infections.
The prevalence rate had dropped to 7,3% from 8%, but that was still too high. Some 2-million Tanzanians are thought to carry HIV or AIDS and 440 000 of them need life-prolonging anti-retroviral (ARV) drugs, Kikwete said.
Under a five-year programme, Tanzania hoped to get ARVs to all people who needed them from a coverage of just 30 000 now, he said.
"It is a matter close to my heart. It is a big challenge and unless we tackle it, our young people could be decimated," Kikwete said.
Kikwete won Tanzanian presidential elections last December and has put sustained growth of east Africa's largest country and fighting corruption at the top of his agenda. - source
Monday, July 10, 2006
Nickel at New All Time High
While some well paid economists, market commentators , journalists and other creatures are working extra hours to convince you that metals and the general commodities markets are simply bubble - nickel quietly front running the pack to make a new all time high of 25,500 USD per metric ton. Nickel futures and options are trading at the London metal exchange (LME).
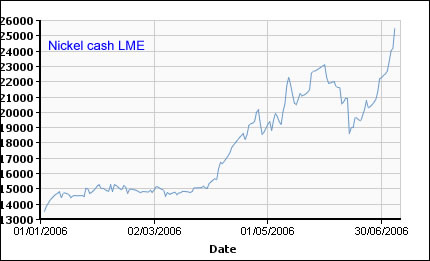
One good reason for the new high might be collapsing stockpiles.
One good reason for the new high might be collapsing stockpiles.
Sunday, July 09, 2006
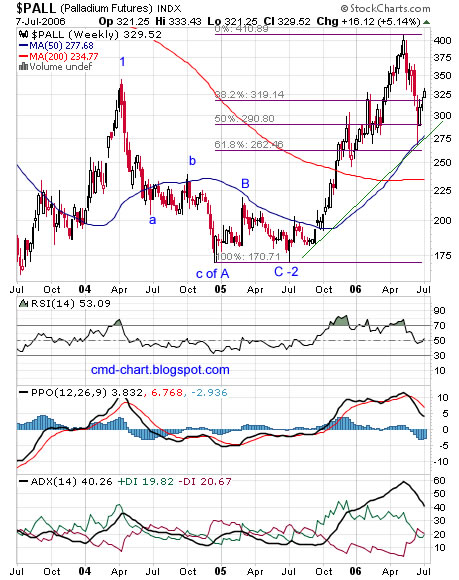
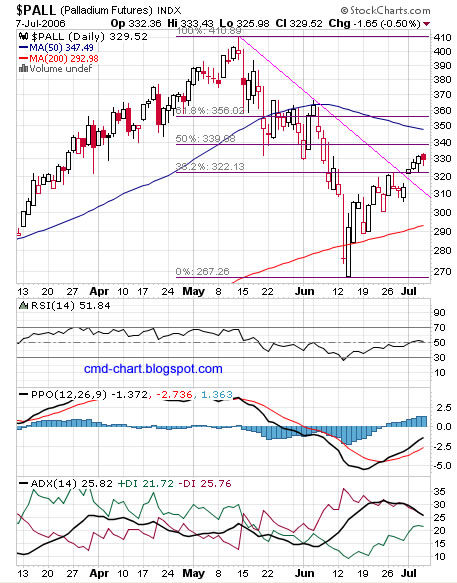
Palladium Futures (NYMEX: PL) Chart Analysis
Palladium had a spectacular rally, up 140% percent in little less then a year!
Topping out at 410$, it then pulled back roughly 61.8% of the rally to touch its 50 weeks moving average (WMA)and bottomed at 267$. Palladium lost 35% in one month!
Palladium weekly chart
The Elliott wave is unclear to me but the most likely scenario: wave three still in progress, this way or that way I think that higher highs will follow. The price of palladium is currently above the 38.2% Fibonacci line and this level should provide some support along the green uptrend line and the 50 WMA. Notice that the 200 WMA is stable and seems to turn back up. RSI turned back up above 50, PPO bearish crossover but still above zero, PPO histogram negative, ADX slightly bearish.
Palladium daily chart
The price of palladium broke up above the pink downtrend line and is currently above the 38.2% Fib and its 200 DMA. RSI trends up above 50, PPO bullish crossover but still below zero, PPO histogram positive, ADX improving. Support at the 38.2% Fib and the 200 DMA, the pink line probably get tested. Resistance at the Fibs above the current price, the 50 DMA and the high (410$).
Related:
Palladium long term Elliott wave count
Gold and Silver charts analysis
Tuesday, July 04, 2006
China Royalties on Mines
Yet another reason to put your money in commodities and not into miners, commodity stocks or commodity manufactures.
China to push for royalties on mines
Jul 4, 2006 8:44 AM GMT164
BEIJING (Reuters) - China will forcefully push to levy royalties on miners to help avoid the excessive development of its mineral resources and allow the government to get a share of the revenue, official Chinese media reported on Tuesday.
Beijing was formulating policies, including different royalties rates for mine explorers and developers and rules on mine transfers, the Economic Daily quoted Vice Minister of Land and Resources Wang Min as saying.
China has historically waived royalties on its miners. That has helped fuel excessive mining of coal, for instance, and made the industry the world's most dangerous.
Existing miners would be evaluated and backpayments of royalties would be charged, the paper said.
The plans are in line with Beijing's moves to raise resources tax and environmental charges on minerals, petroleum and natural gas.
China raised the resource tax on coal a year ago and has recently increased taxes on gold mines. In March, Beijing also started levying a landmark windfall tax on its oil producers, using it to compensate weak consuming groups for high oil prices.
Monday, July 03, 2006
Copper Futures (HG) technical analysis
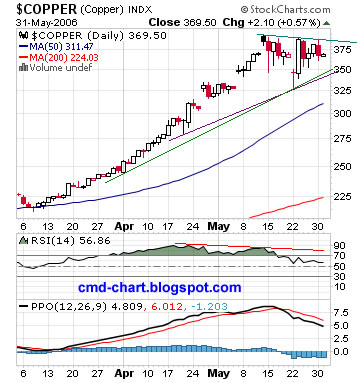
Copper Daily Chart
Short term bottom established at around 2.91$ per pound of copper, this price level is between the 61.8% and the 50% Fibonacci levels of the February – May 2006 wave up. The price of copper traded and closed above the diagonal downtrend resistance line (orange). Copper is currently trading above the 38.2% Fibonacci level of the May – June wave down. A new trend line (green) is visible - connecting the March and June bottoms. RSI trending up above 50, PPO on the verge of crossing over, PPO histogram slightly positive and the slow stochastic trending up above 50.
Short term support at the Fibonacci levels below the current price and at the green uptrend line. Short term resistance at the 50 DMA, the Fibonacci lines above current price and the pink downtrend line coming from May top, which is the all time high for copper.
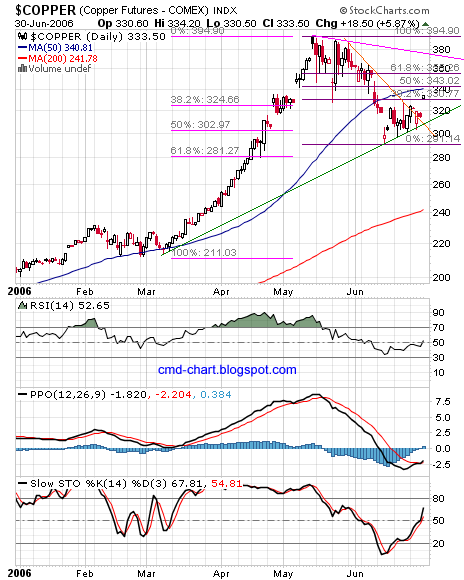
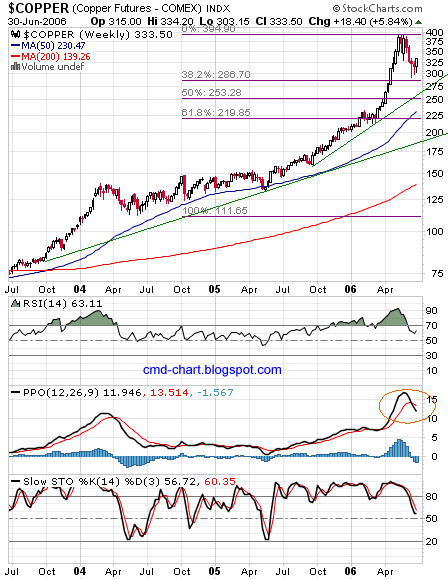
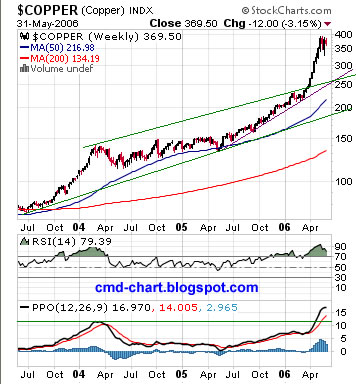
Copper Weekly Chart
The price of copper pulled back to the 38.2% Fibonacci level area of the monster up wave which started at Q2-2004. Short term bottom seems to be in place. RSI still above 50 and turning back up, PPO crossover - bearish, PPO histogram negative and stochastic trending down but still above 50 and might turn up soon.
Support on the intermediate term chart is at the Fibonacci support lines the 50 WMA (blue) and the green uptrend lines.Resistance at all time high : ~4.00$ per pound of copper.
Short term bottom established at around 2.91$ per pound of copper, this price level is between the 61.8% and the 50% Fibonacci levels of the February – May 2006 wave up. The price of copper traded and closed above the diagonal downtrend resistance line (orange). Copper is currently trading above the 38.2% Fibonacci level of the May – June wave down. A new trend line (green) is visible - connecting the March and June bottoms. RSI trending up above 50, PPO on the verge of crossing over, PPO histogram slightly positive and the slow stochastic trending up above 50.
Short term support at the Fibonacci levels below the current price and at the green uptrend line. Short term resistance at the 50 DMA, the Fibonacci lines above current price and the pink downtrend line coming from May top, which is the all time high for copper.
Copper Weekly Chart
The price of copper pulled back to the 38.2% Fibonacci level area of the monster up wave which started at Q2-2004. Short term bottom seems to be in place. RSI still above 50 and turning back up, PPO crossover - bearish, PPO histogram negative and stochastic trending down but still above 50 and might turn up soon.
Support on the intermediate term chart is at the Fibonacci support lines the 50 WMA (blue) and the green uptrend lines.Resistance at all time high : ~4.00$ per pound of copper.
Thursday, June 29, 2006
Commodities Market News
Goldman May Buy Stake in India's Commodity Exchange
June 29 (Bloomberg) -- Goldman Sachs Group Inc., the world's biggest securities firm, plans to buy a stake in India's National Commodity & Derivatives Exchange Ltd. to gain from a surge in trading in Asia's second-fastest growing major economy.
Goldman will buy the stake from ICICI Bank Ltd., India's second-largest lender, two people familiar with the matter said, asking not be identified before an official announcement. Edward Naylor, a Goldman spokesman in Hong Kong, and Vishakha Mulye, chief financial officer of ICICI Bank, declined to comment.
Trading on India's commodity exchanges totaled $460 billion in the year ended March 31, a fourfold jump from the year before, as economic growth boosted disposable incomes and fueled investments in commodities. That spurred Fidelity International Ltd., a unit of the world's biggest money manager, in February to pay $49 million for 9 percent of the Multi Commodity Exchange of India Ltd., the world's third-biggest bullion bourse.
``It's a good move as commodity exchanges in India are just taking off and are in a growth phase,'' said Sanjay Dongre, a fund manager at UTI Mutual Fund, which oversees about $6.6 billion in investments. ``One could expect turnover at commodity exchanges to rise and an investor could reap benefit.''
Goldman may buy 10 percent of the National Commodity Exchange, India's Economic Times and Financial Express newspapers reported today, citing unidentified people. The investment may be Goldman's biggest in India since the company ended a 10-year venture with Kotak Mahindra Bank Ltd., an Indian lender, in March.
Goldman would invest in private equity, fund-to-fund and real estate businesses in India, Brooks Entwistle, head of the company's Indian operations, said in March.
India, the world's biggest consumer of gold and second- biggest producer of sugar and rice, trades futures contracts in more than 80 commodities in 500 locations.
Local traders and producing and consuming companies are the main participants on the bourses. S. Sundareshan, chairman of the Forward Markets Commission, said last month the regulator may permit overseas investors to trade in oil and bullion futures before expanding the list to include some farm products.
Buying a stake in the exchange will allow Goldman to ``capture the volume growth in the commodity derivatives business,'' Vineet Bhatnagar, managing director at Man Financial Commodities India Ltd., a Mumbai-based brokerage, said by telephone from Singapore.
Volume on the National Commodity Exchange, which trades futures contracts in 48 commodities, reached $226 billion in the year ended March 31, according to the Forward Markets Commission. That's more than the $184 billion of shares traded on the Mumbai stock exchange, Asia's oldest, in the same period. -source
Nymex looking to start gold futures trade in China
BEIJING (XFN-ASIA) - The New York Mercantile Exchange (Nymex) is hoping to begin the trading of gold futures contracts in China, the Wall Street Journal said, citing a senior exchange official
John Hanemann, vice chairman of the governors committee of Nymex's Comex Division, was quoted by the newspaper as saying the exchange has been in talks about launching its gold futures contracts with Chinese exchanges
China, meanwhile, has been looking to further develop its local derivatives markets, the report said
"We have been seeking opportunities to cooperate with Shanghai Gold Exchange to launch gold futures, perhaps as a joint product," Hanemann said
The plan, if it goes through, will not only see the first gold futures contracts being traded in China, but would also be the first joint derivatives product between a Chinese bourse and an overseas exchange, the newspaper reported
Currently, the trading of gold bullion, gold bars and platinum on the Shanghai Gold Exchange is limited to spot transactions. Chinese investors are not allowed to trade futures on overseas exchanges, the newspaper said
This also applies to state-controlled institutions, except those that have special licenses from the government. China's futures markets are also off-limits to foreign investors, the report said
Hanemann did not provide a timeframe for the launch of such a product, which is still being deliberated by the China Securities Regulatory Commission. The regulators are likely concerned about the risks of derivatives trading, the newspaper said
China is the world's fourth-largest gold producer and consumer
Last week, the China's central bank suggested the country can convert part of its foreign exchange reserves to gold holdings to head off risks from the depreciation of the US dollar, state media reported
Converting part of foreign exchange reserves to gold can protect and increase the reserve assets, the official Shanghai Securities News reported - source
Tuesday, June 27, 2006
Lehman Brothers Commodity Index (LBCI)
NEW YORK, June 27 (Reuters) - U.S. investment banking group Lehman Brothers said on Tuesday it has launched a new commodity index of 20 products covering energy, metals, agriculture and livestock -- the four main segments of the raw materials market.
Initial returns on the Lehman Brothers Commodity Index - which tracks dollar-denominated commodities futures for a start -- would be available from the close of business on July 3.
Individual commodity indices would be published as well, the group said in a statement.
"We feel we have designed a commodity benchmark that is truly transparent and representative of the commodity market while providing a weighting scheme that will appeal to investors," Nicholas Gendron, Lehman Brothers' global head of Indices, said in the statement.
Lehman said it planned to re-set the weights of the individual commodities on the index annually. Weightings will fluctuate throughout the year based on price movements.
The weights of the major components of the index as of the beginning of 2006 were: 56.2 percent for energy; 22.8 percent for metals; 18.2 percent for agriculture, and 2.8 percent for livestock.
Based on price movements since, the weights -- as of June 23 -- were: 52.9 percent for energy; 27.2 percent for metals; 17.4 percent for agriculture, and 2.5 percent for livestock.
Lehman Brothers said it also plans to release future versions of the index that would include commodities from other non-U.S. exchanges and denominated in non-U.S. currencies.
"It is clear the commodities market has evolved to the point where we believe there is demand for both global and regionalized versions" of the index, said Neil Wardley, senior vice president for Lehman Brothers' index strategy group. -source
Sunday, June 25, 2006
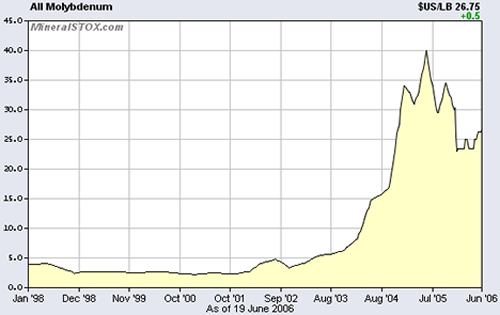
Molybdenum (Moly) Chart
Molybdenum is a silver white metal - basic material, chemical element in the periodic table. Molybdenum symbol is Mo and its atomic number 42.
Molybdenum is very hard metal and has one of the highest melting points(2623 °C) of all pure elements. Molybdenum is mostly used in alloys like steel.
Molybdenum is very hard metal and has one of the highest melting points(2623 °C) of all pure elements. Molybdenum is mostly used in alloys like steel.
Tuesday, June 20, 2006
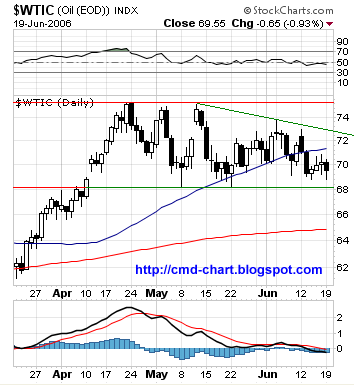
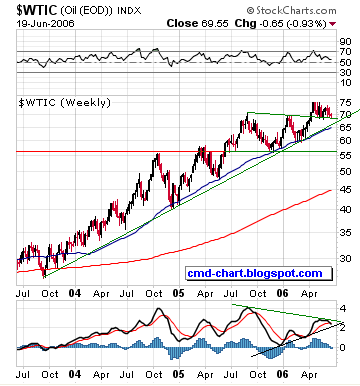
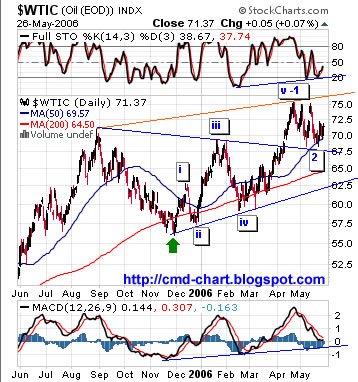
Crude Oil (WTI) Charts
Crude Oil is not only the most important commodity but also a major component in any commodity index (CRB, RICI, DBLCI - DBC etc.).
Short term (daily chart) crude oil is consolidating in a relatively tight trading range of 7$ (75$ - 68$) ,Resistance at the 50 DMA , downward diagonal line and the top of the trading range(~75$). Support at the bottom of the trading range (~68$) and the 200 DMA.
Long term (weekly chart) sustained uptrend but a bit of deceleration. Support at long term uptrend line (~67$), the 50 WMA, strong support at 56$.
Investors and traders can get direct exposure to the price of crude oil with crude oil futures and derivatives and the USO ETF. Diversified exposure to crude oil related equity can be achieved with ETFs like the XLE (Energy Select Sector SPDR) and the OIH (Oil Services Holders).


Monday, June 19, 2006
Resource nationalism may impact mining - World Bank
A fresh rise in resource nationalism seen in some parts of the world could have an unfavourable impact on the mining industry, a World Bank official said on Thursday.
Peter van der Veen, manager of the World Bank's mining policy division, said that while there had been successful examples of state ownership there were also cases where nationalisation had not worked.
Speaking at a seminar in Tokyo, van der Veen said: "Overall, especially in mining, I would say governments have not proven to be very responsible and good ... owners and operators of mines."
Van der Veen said that Chile's Codelco, the world's top copper producer, was one of the cases where state-ownership had proved successful.
But, he noted that Zambia's efforts to nationalise its copper operation had led to a steep decline in production. Annual copper output at one point fell below 300 000 tons from a peak at 700 000 tons in the 1970s.
Zambia sold the country's key copper mines to the private sector in 2000. Copper production has now recovered to about 500 000 tons, van der Veen said.
Some South American countries have recently moved to nationalise their resources spurred by the recent rise in global commodities prices and the wish for a greater share in the profits.
"Governments feel there is an opportunity, to indeed get a better share of the cake," van der Veen said. -source
Sunday, June 18, 2006
Venezuela to take over inactive mines
CARACAS, Venezuela, June 16 (Reuters) - Venezuela plans to take over all inactive mining areas to form new joint ventures with a state majority stake and state-backed small mining groups foreseen under a mine law reform, Mining Minister Victor Alvarez said on Friday.
The mine reforms follow measures by Venezuelan President Hugo Chavez to increase state control over the energy industry of the world's No. 5 crude exporter, where foreign and local companies were this year forced to accept new joint ventures giving the state oil firm PDVSA majority control.
"The areas that are inactive are going to be recuperated and rescued by the Venezuelan state," Alvarez told reporters outside the Congress where he handed over the proposed reforms to lawmakers.
Chavez, an ally of Cuba who says he is constructing a socialist revolution for the poor, has attacked oil contracts signed before his 1998 election for "robbing" Venezuela's resources by giving preferential terms to foreign operators.
Alvarez refused to comment directly when asked whether the reforms would affect Canadian gold miner Crystallex International (KRY.TO), which is waiting for the government to approve a final environmental permit to start proper mining.
Crystallex has said its operating contract for the huge Las Cristinas gold mine will not be affected by the mine law reforms. But one lawmaker in the congressional mining commission said he believes the Canadian miner would be included, without giving more details.
"Sometimes the process of getting permits is used as an excuse and a pretext to justify inactivity," Alvarez said, without naming any mine operations.
He said miners in production and with their affairs in order would not be included in the changes.
Earlier this year, former paratrooper Chavez said his government would no longer authorize new mining concessions and ordered a review of the industry, sparking market jitters as investors fretted over foreign gold miners such as Crystallex.
Mining will be carried out through operating contracts with the state mining company, though joint ventures where the state has majority control and through small mine operations such as cooperatives, according to a draft of the law reforms.
The proposal says current contracts can continue working unless they break the law or their production halts for more than a year or they fail to pay taxes or do not comply with social spending requirements demanded by the government.
Lawmakers loyal to Chavez control all 167 seats in the congress after opposition parties boycotted a December legislative ballot to protest what they said was bias by election officials - source
Wednesday, June 14, 2006
Russian mineral resources to remain open to foreigners - Putin
ST. PETERSBURG, June 13 (RIA Novosti) - President Vladimir Putin said Tuesday that Russia planned to impose restrictions on access to large deposits of mineral resources, but did not mean to deny foreign companies access to them.
Meeting with foreign business leaders at an economic forum in St. Petersburg, Putin said: "We have been discussing ways to ensure Russia's national interests related to its largest deposits of mineral resources ... and here we plan special regulations."
He said restrictions did not mean foreign companies would have no access to deposits that could be classified as "strategic," but that the state should have greater control over them.
Foreign companies are currently allowed to hold no more than 49.5% in projects involving "strategic" deposits - primarily in the energy sphere, but also including metals such as gold and copper. -source
Friday, June 09, 2006
Platinum & Palladium Futures
Platinum (PL) and Palladium (PA) futures contracts and options on futures contracts are trading at the New York Mercantile Exchange (NYMEX.)
Like Gold and Silver, Platinum and Palladium are at an ongoing correction, Palladium has lost around 38% of the last up leg, platinum have held better. Platinum recent up leg was longer then the up leg in the price of palladium or gold, Palladium is usually more volatile then Platinum.
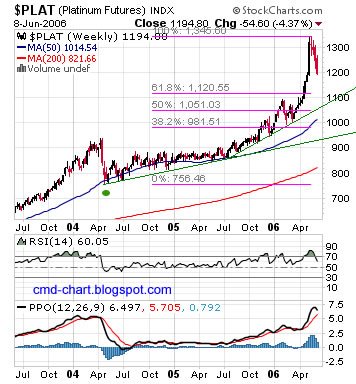
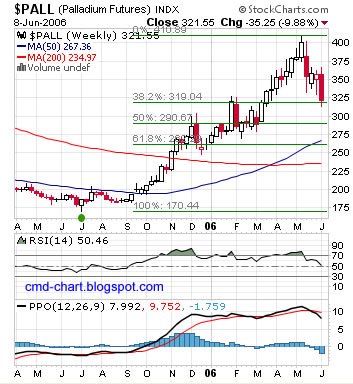
Like Gold and Silver, Platinum and Palladium are at an ongoing correction, Palladium has lost around 38% of the last up leg, platinum have held better. Platinum recent up leg was longer then the up leg in the price of palladium or gold, Palladium is usually more volatile then Platinum.


Wednesday, June 07, 2006
NYMEX and Multi Commodity Exchange of India Sign Licensing Agreement
Global energy contracts now available on Indian platform
NEW YORK and MUMBAI, India, June 6 /PRNewswire/ -- The New York
Mercantile Exchange, Inc. (NYMEX), and the Multi Commodity Exchange of
India Limited (MCX) announced today that they have signed a five-year
licensing agreement for the use of NYMEX energy futures settlement prices.
In addition to the current MCX rupee-denominated, financially settled
light sweet crude oil futures contract, which is one-tenth of the size of
the NYMEX light sweet crude oil futures contract, the new licensing
agreement includes rupee-denominated natural gas, heating oil, and gasoline
futures contracts that MCX plans to launch. These new contracts will be
financially settled by MCX based on the settlement prices for the
corresponding physically settled NYMEX futures contracts and one-tenth of
the size of the NYMEX contracts. The agreement also anticipates the launch
of additional rupee-denominated contracts in RBOB gasoline and propane
futures.
Celebrating the agreement, India's Union Minister of Agriculture,
Consumer Affairs, Food & Public Distribution, Sharad Pawar, marked the
commencement of trading with the traditional ringing of the opening bell at
NYMEX in New York.
In October 2005, NYMEX and MCX signed a memorandum of understanding
that allows MCX to use NYMEX settlement prices for its light sweet crude
futures contract.
James E. Newsome, NYMEX President and Chief Executive Officer, said,
"This agreement with MCX will provide a benchmark price reference for risk
management to the Indian energy sector, a significant user of such products
from the global standpoint, while also optimizing the cost of such risk
management."
Venkat Chary, Chairman of the MCX, added, "Producers, users and
investors in India can take benefit from access to globally aligned prices
and trading practices in such energy products. We proudly bring these
products to the Indian industry."
Jignesh Shah, Managing Director and Chief Executive Officer of MCX
said, "MCX will leverage its pan-India presence, and its member and client
network spread across the country, to offer mini-NYMEX energy contracts to
a range of stakeholders in the industry. It will also facilitate the price
discovery of these products in the Indian time zone based on local
fundamentals."
About the New York Mercantile Exchange:
The New York Mercantile Exchange is the largest physical commodity
exchange in the world, offering futures and options trading in energy and
metals contracts and clearing services for off-exchange energy
transactions. Through a combination of open outcry floor trading and
electronic trading, a wide range of crude oil, petroleum product, natural
gas, coal, electricity, gold, silver, copper, aluminum, and platinum group
metals markets are available virtually 24 hours each day.
About Multi Commodity Exchange:
MCX is an independent and de-mutualised exchange with permanent
recognition from the Government of India to facilitate nationwide online
trading, clearing and settlement operations for the commodities futures
market. MCX is the world's second largest silver exchange and third largest
gold exchange in terms of trading volume among the top ten commodities
derivatives exchanges in the world. MCX offers futures trading across a
range of market segments including bullion, energy, ferrous and non-ferrous
metals, agricultural and industrial products. Promoted by Financial
Technologies (India) Ltd. a provider of transaction automation
technologies, the key shareholders of MCX include State Bank of India
(India's largest commercial bank) and its subsidiaries, National Stock
Exchange (NSE), National Bank for Agriculture and Rural Development
(NABARD), and several other Indian banks.
Forward Looking and Cautionary Statements
This press release may contain forward-looking statements within the
meaning of the Private Securities Litigation Reform Act, with respect to
our future performance, operating results, strategy, and other future
events. Such statements generally include words such as could, can,
anticipate, believe, expect, seek, pursue, and similar words and terms, in
connection with any discussion of future results. Forward-looking
statements involve a number of assumptions, risks, and uncertainties, any
of which may cause actual results to differ materially from the
anticipated, estimated, or projected results referenced in forward-looking
statements. In particular, the forward-looking statements of NYMEX
Holdings, Inc., and its subsidiaries are subject to the following risks and
uncertainties: the success and timing of new futures contracts and
products; changes in political, economic, or industry conditions; the
unfavorable resolution of material legal proceedings; the impact and timing
of technological changes and the adequacy of intellectual property
protection; the impact of legislative and regulatory actions, including
without limitation, actions by the Commodity Futures Trading Commission;
and terrorist activities and international hostilities, which may affect
the general economy as well as oil and other commodity markets. We assume
no obligation to update or supplement our forward-looking statements.
source
Monday, June 05, 2006
Does keeping the penny still make sense?
It's all about the price of Zinc and Copper
By J. Scott Orr
Newhouse News Service
WASHINGTON — They accumulate everywhere, multiplying faster than bunnies, it seems, in pockets, purses and dresser-top jars. And you can't buy much with them.
So why doesn't the United States get rid of the penny, especially now, when, for the first time, the copper-coated coins cost the government more than 1 cent each to make?
At least one bill has been introduced in Congress to retire the coin, but it never gained traction. And the bottom line may be that when it comes to the penny, Americans don't want change.
"Americans want to keep the penny, it's that simple," said Matthew Eggers, policy director of Americans for Common Cents, which is fighting to keep the coin in circulation.
The most recent survey — conducted last year by Coinstar, a Bellevue company that puts coin-counting machines in supermarkets and other locations — found 66 percent of Americans want to keep the penny. It also found 79 percent will stop to pick up a penny.
But the penny's detractors have been buoyed by new figures from the U.S. Mint that show the skyrocketing prices of the two metals used to make the penny — zinc and copper — have pushed the cost of making the coin across the 1-cent threshold for the first time, to 1.23 cents. The penny is 97.5 percent zinc and 2.5 percent copper, according to the mint... -source
Deutsche Bank Liquid Commodities Indices Optimum Yield (DBLCI-OY)
Interesting development for commodity Investors and traders:
Deutsche issues flexible commodity index products
LONDON (Reuters) - Deutsche Bank said on Friday it was launching a new set of commodity index products, which will improve yields in passive, long-only instruments.
The Deutsche Bank Liquid Commodities Yield Indices Optimum Yield (DBLCI-OY) would improve on the traditional method of commodity indices where futures contracts roll on a pre-defined schedule, the bank said in its weekly report.
"The DBCLI-OY indices are designed so that rather than selecting the futures contract on a pre-defined schedule they roll into the futures contract that either maximises the positive yield roll in backwardated term structures or minimises the negative roll yield in contangoed markets," it said.
The Dow Jones-AIG, the Goldman Sachs Commodity Index and its own Deutsche Bank Liquid Commodity Index (DBLCI) have contracts which are rolled monthly, but the shifting pattern in commodity structures over the past few years has led to the creation of the new index, it added.
In a contango market, cash prices are cheaper than forward values, reflecting storage and insurance costs for future delivery. A backwardation is the opposite -- cash is dearer than the forward position, reflecting nearby shortages.
Metals, such as copper and zinc, recently at record highs, have established backwardation price structures stretching out five years in some instances. -source
Wednesday, May 31, 2006
Copper HG COMEX Futures
Copper is extremely parabolic. I'm sure there are excellent fundamentals for the extraordinary spike in the price of copper but technically it is extreme. On the daily chart both RSI and PPO are trending down but the price haven't pulled back much. Copper is forming some kind of triangle pattern and pattern resolution should soon follow. The weekly charts tells a different story , RSI and PPO looks pretty good and the pattern still looks reasonably bullish. Copper haven't necessarily seen its top yet.

Browse this blog archive
See Gold, Silver, Metals mining stocks

Browse this blog archive
See Gold, Silver, Metals mining stocks
Jim Rogers International Commodity Index
It is almost impossible to run a blog about commodities without reminding Jim Rogers – a living legend in our modern investment / trading world.
Much has been said about Jim Rogers who made his fortune as a Soros Quantum fund partner. Mr. Jim Rogers developed the Rogers International Commodity Index (RICI) which tracks the price of 35 commodities futures from Crude Oil through Gold and Silk. Since November 2005 the Rogers International Commodity Index is tracked by the Rogers TRAKRS contract which trades at the Chicago Mercantile Exchange – CME.
Jim Rogers is the Author of three books:
Hot Commodities : How Anyone Can Invest Profitably in the World's Best Market.
Adventure Capitalist: The Ultimate Road Trip.
Investment Biker: Around the World with Jim Rogers.
Listen to Jim Rogers Interview - HoweStreet.com
Much has been said about Jim Rogers who made his fortune as a Soros Quantum fund partner. Mr. Jim Rogers developed the Rogers International Commodity Index (RICI) which tracks the price of 35 commodities futures from Crude Oil through Gold and Silk. Since November 2005 the Rogers International Commodity Index is tracked by the Rogers TRAKRS contract which trades at the Chicago Mercantile Exchange – CME.
Jim Rogers is the Author of three books:
Hot Commodities
Adventure Capitalist
Investment Biker
Listen to Jim Rogers Interview - HoweStreet.com
Tuesday, May 30, 2006
Commodities News
Tokyo Commodity Exchange and Shanghai Futures Exchange sign MOU
The Tokyo Commodity Exchange (TOCOM) and Shanghai Futures Exchange (SHFE), two leading futures exchanges in Asia for metals, energy and rubber signed a Memorandum of Understanding (MoU) in Shanghai on May 26, 2006 to share information and establish a future cooperative framework. This occurred just before the 3rd Shanghai Derivatives Market Forum hosted by SHFE. -source
Eramet to invest $1.5 bln in Indonesian project
AKARTA, May 30 (Reuters) - French nickel miner Eramet said on Tuesday it plans to invest around $1.5 billion to develop the Weda Bay nickel project in eastern Indonesia.
Earlier this month, Eramet acquired nearly all shares of Toronto-listed Weda Bay Minerals Inc. The main investor in Indonesia's PT Weda Bay Nickel. Indonesian nickel producer PT Antam owns 10 percent of the Weda Bay project. -source
Saturday, May 27, 2006
Crude Oil Futures WTI Elliott Wave Analysis
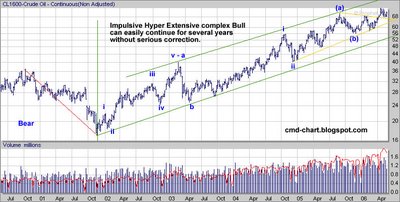
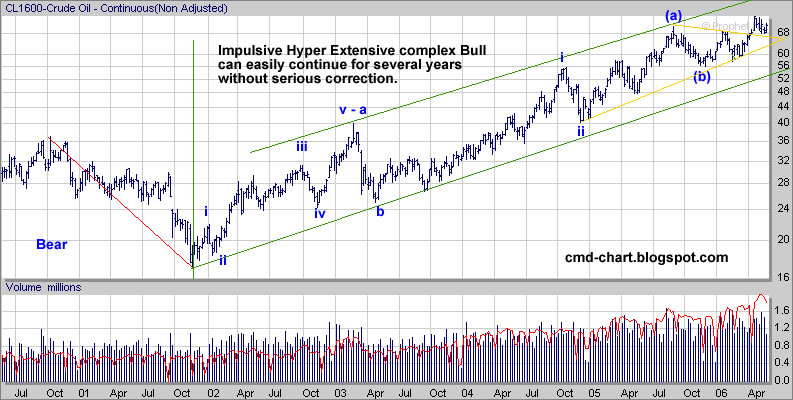
Crude is trading in a rising channel for more then four years.
The Oil WTI wave is complex, Impulsive and Hyper Extensive, Bull wave that can easily extend even further and continue for several years without serious correction. I will not be in a hurry to call the top for crude oil as the chart is nowhere near to suggest that. Crude Oil is an important corner stone in this great global commodity bull market. Some clumsy reporters like to mistakenly call it the black gold – it is an oxymoron!
So.. Looking at the weekly chart it easy to see that the pullbacks have been modest since the bull cycle started late 2001. The channel is intact and the price has room to move in both directions. On the daily chart again partial wave count with the next move likely to be wave 3 up to new all time high , I would like to remind the number 81$ as an initial target , partial profit taking suggestion.
Click charts to enlarge:

Friday, May 26, 2006
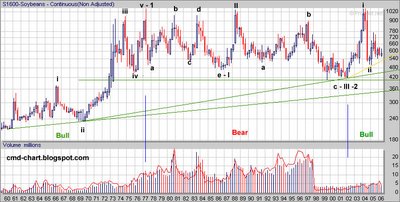
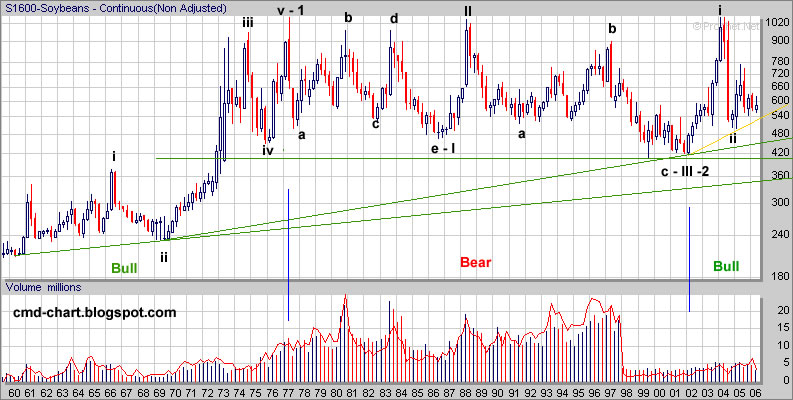
Soybeans Futures (S) Elliott Wave Count Analysis
Soybeans Futures contracts and soybeans Options on futures contracts are trading at the Chicago Board of Trade (CBOT). Contract Size = 5,000 bushels. Like Oats Futures (O) I notice steep Volume decline since the nineties. - If anyone can contribute more info regarding Soy beans please add comment or send email
You can click on the chart to enlarge:
You can click on the chart to enlarge:
Thursday, May 25, 2006
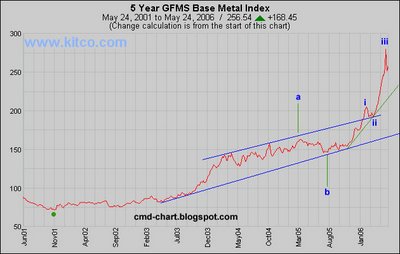
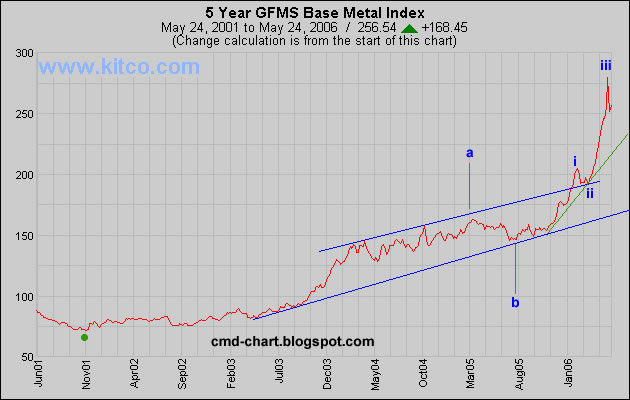
GFMS Base Metal Index Waves Analysis
GFMS base metal index is based on the official London Metal Exchange - LME - cash settlement price for primary aluminium, copper, lead, nickel, tin and zinc. The index is an average of the six prices with equal weighting given to each of the six metals. The index is based on January 4th 2000 = 100.
Click on the chart below to enlarge
Click on the chart below to enlarge
Tuesday, May 23, 2006
Oats Futures (O) CBOT
Oats Futures contracts and Options on Futures are trading at the Chicago Board of Trade (CBOT). Contract size is 5,000 bushels No. 2 Heavy and No. 1 at par. For more details See CBOT.
Technically, Oats futures contracts are currently trading at the same nominal price like 1975 !
The Elliott wave count is quite odd, however that the best I could do, If you have another wave count please send it to me. If you need a basic Elliott Wave tutorial see EWI (might need registration)
If you look at the logarithmic chart the triangle pattern is not yet broken to the upside. Whereas On the linear oats futures chart the triangle is already broken to the upside.
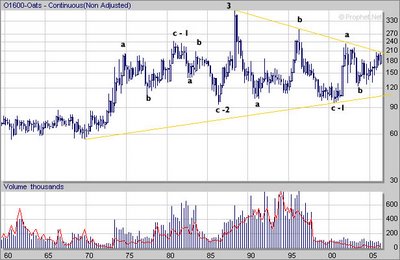
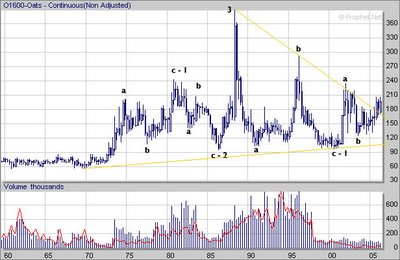

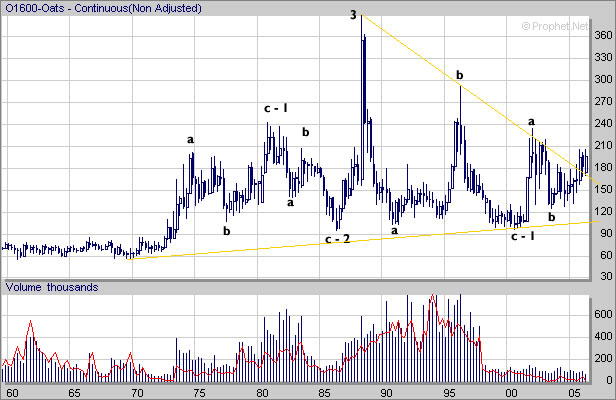
Sunday, May 21, 2006
Rough Rice Futures
Rough Rice Futures and Options on Futures are trading at the Chicago Board of Trade (CBOT). Contract size is 2,000 hundredweight (cwt.) of U.S. No. 2 or better long grain rough rice. For more details See CBOT
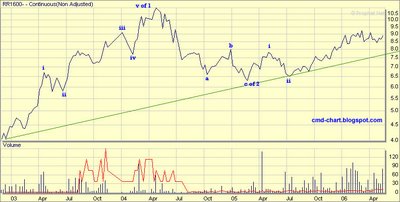

Friday, May 19, 2006
Rhodium price chart

Rhodium arrows toward $7 000
19/05/2006 12:37 PM
London - Rhodium jumped to a 26-year high on Friday due to endemic supply tightness, and prices look set to exceed 1980's all-time record of $7 000 an ounce soon.
Traders said an already tight market for rhodium, used in the manufacture of autocatalysts and in glass-making, was being squeezed further by speculators buying a metal that has jumped 105% this year.
"Definitely it will hit that historic high soon. How high can it go - who knows?" a trader said.
Spot rhodium was at $6 150/$6 250 an ounce, having sped higher from last week's $5 300/5 400 without interruption.
Apart from a mid-2000 price peak, rhodium has been in the doldrums for most of the last 25 years, trading as low as $190 in 1997.
Demand for LCD's
But demand is growing strongly, with plasma LCD (liquid crystal display) glass-makers the latest boom sector, and supply cannot keep up.
"It is quite simple, demand has been good for the last few years and stocks have been run down," another trader said.
Earlier this week top refiner Johnson Matthey, in its annual review of platinum metals, highlighted the strong fundamental picture as demand rose sharply during 2005, further outpacing supplies and widening the market's deficit.
"With demand for rhodium growing by more than twice the rate of increase in supplies, the market moved to a deficit of 58 000 ounces," Johnson Matthey said.
Consumption rose to 812 000 ounces in 2005, equalling the 2000 record, up from 2004's 729 000 ounces as use in autocatalysts, glass and chemical applications rose.
Supply rose by 5% to 754 000 ounces from 2004's 720 000, with South African output climbing 7% to 627 000 ounces. -source
Stephen Roach try to talk down commodities...
Stephen Roach - Morgan Stanley Chief Economist try to talk down commodities, will it work? - I don't think so... It amaze me that all those highly "educated" economists fail to understand that higher commodities prices are exactly what it takes to reduce demand and increase supply.
05-18-06 03:17 PM EST
BOSTON (Dow Jones) -- Morgan Stanley Chief Economist Stephen Roach thinks there's a speculative bubble in commodities, and it's not a matter of if it will burst, but when.
"Asset bubbles have dominated financial market experience over the past six years," Roach wrote in a note to clients earlier this week, pointing to the initial bounce in stocks followed by runs in bonds, real estate and derivatives.
"Like clockwork, liquidity-driven investors have migrated from asset to asset, desperately in search of yield," he said. "The world is now in the midst of another bubble -- this one in commodities."
The economist said the jumps in prices of materials the past few months are reminiscent of charts of dot-com stocks in late 1999 and 2000.
"That speaks to an important aspect of any speculative bubble -- price excesses that spread into the far reaches of an asset class."
Last week gold futures hit a high of $728 an ounce, their highest level in almost 26 years, but since then metals have suffered a sharp and unsettling three-day pullback. - source
- Gold Global Perspective: To melt or not to melt: That's the coin question...
- CRB commodity index & DBC commodity ETF
- Gold, Silver, Metals Mining Exploration & Political Risk reports
Crude OIL WTI Elliott wave count ; USO AMEX ETF
Crude Oil - one of the most important commodities if not the most important. Since the USO ETF(United States Oil Fund Lp)IPO Investors or stock traders can get direct exposure to the price of WTI crude oil.
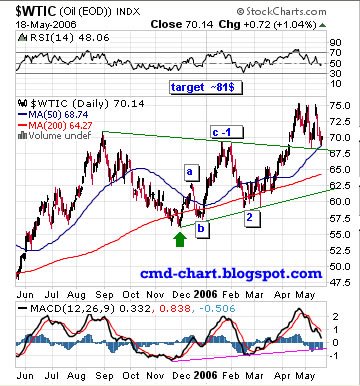


Thursday, May 18, 2006
CRB commodity index & DBC commodity ETF
I read a lot of bearish comments about commodities and gold, some even claiming it's a commodity bubble. Let's look at the charts (the facts):
Short term (daily chart) the CRB commodity index is correcting a little bit:
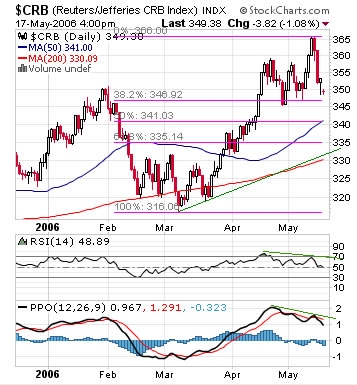
Long term (weekly chart), do you see the trend? , yes it's clearly up:
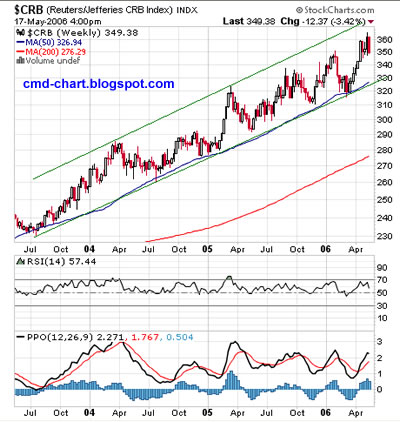
Deutsche Bank has done a good job with its DBC commodity ETF. Since the DBC IPO (February 2006) the DBC outperformed the CRB commodity index. DBC tracks the DBLCI index (Crude Oil, Heating Oil, Gold, Aluminum, Corn and Wheat)
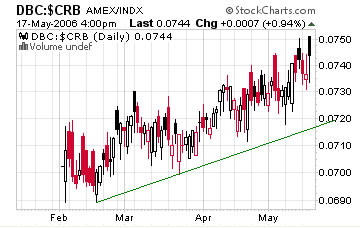
Investors who don’t trade futures contracts might use the DBC ETF to get direct exposure to commodity prices.
Tuesday, May 16, 2006
Platinum, Palladium, Rhodium, Ruthenium & Iridium Supply Demand Analysis Report
Johnson Matthey precious metals division has published a detailed report regarding the Platinum group metals (PGM). The report includes detailed supply demand analysis for: Platinum, Palladium, Rhodium, Ruthenium & Iridium - link
Wednesday, May 10, 2006
Crude Oil Futures (NYMEX: CL) , USO (oil ETF) Charts
Crude Oil broke out of a triangle pattern and made a short term top at ~ 75$ it then headed back down to retest the triangle , this is technically normal and the initial price target for WTI crude oil remains ~81$ . See previous Crude Oil posts
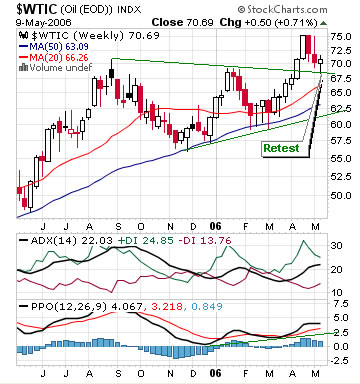
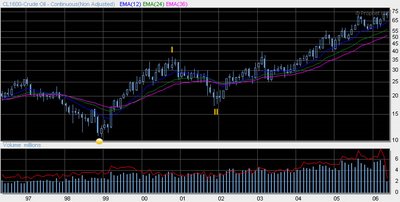


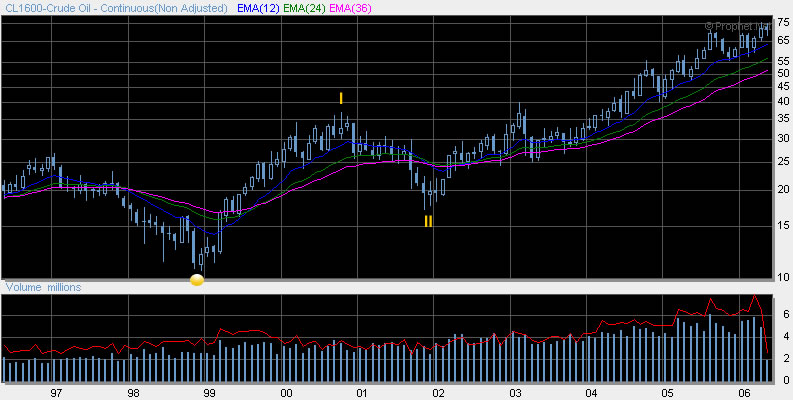
Tuesday, May 09, 2006
Investors Held $120 Bln in U.S. Commodities, Citigroup Says
May 9 (Bloomberg) -- Investors and speculators held more than $120 billion of bets in U.S. commodities markets in April, the second-highest amount on record, helping to drive up prices of raw materials from oil to copper, Citigroup Inc. said.
Speculators held about $30.3 billion in natural gas bets, and $30.1 billion in oil bets, out of the 36 commodities studied, Citigroup analyst Alan Heap said in a May 5 report. The two commodities accounted for 47 percent of the bets held, followed by gold at 17 percent, or $13.3 billion, and copper 3 percent.
Investors worldwide are buying commodity-linked indexes and futures, seeking to beat returns from stocks and bonds as concern about raw material shortages pushes oil and copper to records. Global investments in commodity funds totaled about $200 billion in February, Heap had said then.
``We believe the hike in speculative positions has been a key driver for the latest surge in commodity prices,'' Heap said in the report.
Crude oil in New York has risen 15 percent this year, and gold has soared 31 percent. Copper futures prices in New York have jumped 72 percent this year. By contrast, the Standard and Poor's 500 Index of stocks has gained 6.1 percent.
Saturday, May 06, 2006
Frozen Pork Bellies Futures (CME: PB) Elliott Wave count
Frozen Pork Bellies Futures and Options on Futures are trading at the Chicago Mercantile Exchange(CME).
Contract Size = 40,000 pounds of frozen pork bellies, cut and trimmed.
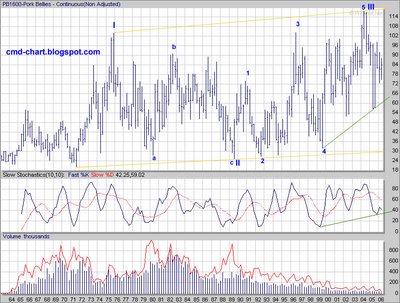
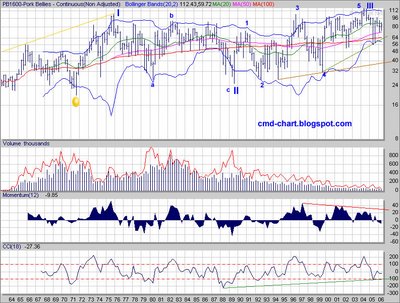
Contract Size = 40,000 pounds of frozen pork bellies, cut and trimmed.
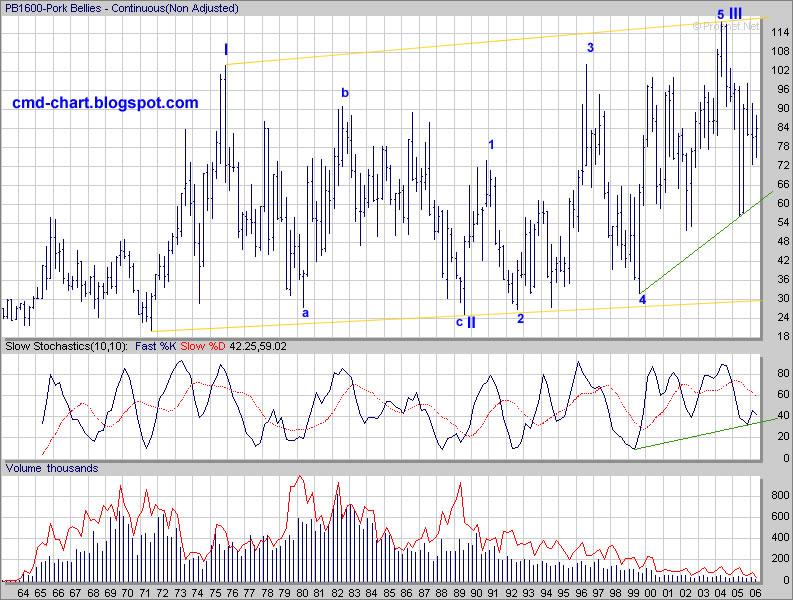

Monday, May 01, 2006
Palladium Futures (PA, NYMEX) Charts & Waves
Here are three charts of palladium annotated with Elliott wave counts, the first chart is a weekly log chart. The other two are long term (30 years) quarterly palladium futures charts, log and linear. If you are new to Elliot wave read this Free Elliot wave tutorial, if you want to know more about Elliot wave I recommend that you read this book and try the EWI subscription (30 days Free trail)
Click on the charts below to enlarge:
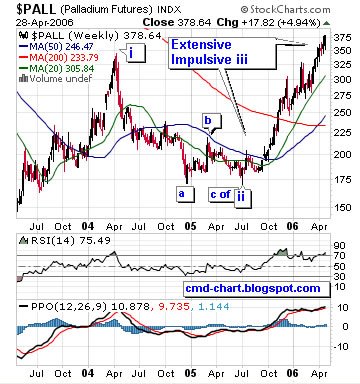
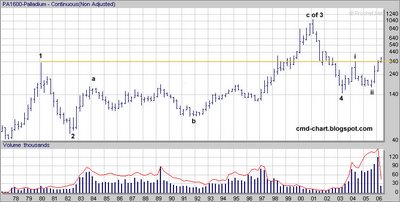
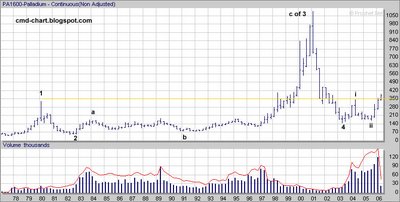
Click on the charts below to enlarge:

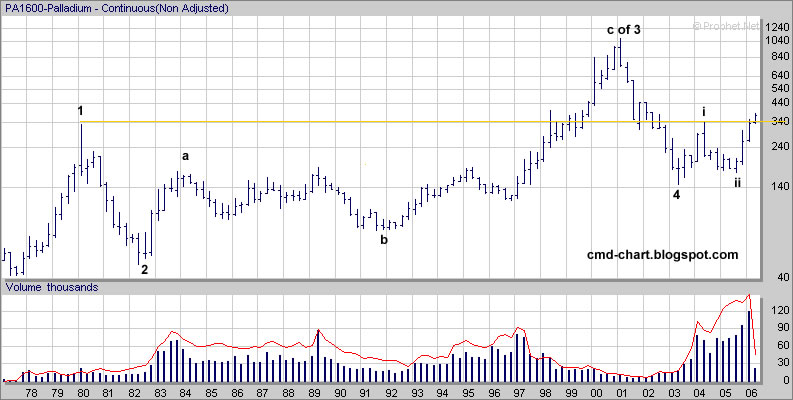
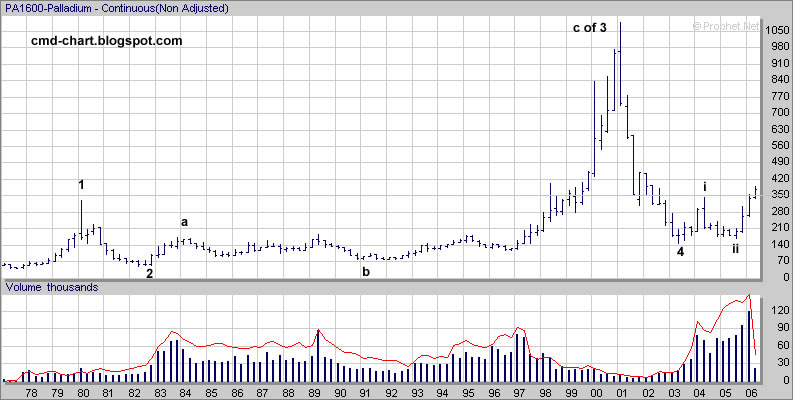
Thursday, April 27, 2006
Platinum Futures (NYMEX: PL) , Chart
Platinum is trading above the 1980 high. The daily platinum futures chart is looking good with many white candles, short term trend line support ~ 1105$. Platinum Info.
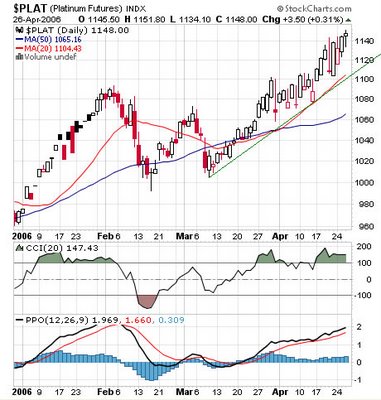


Gold & Silver spot charts
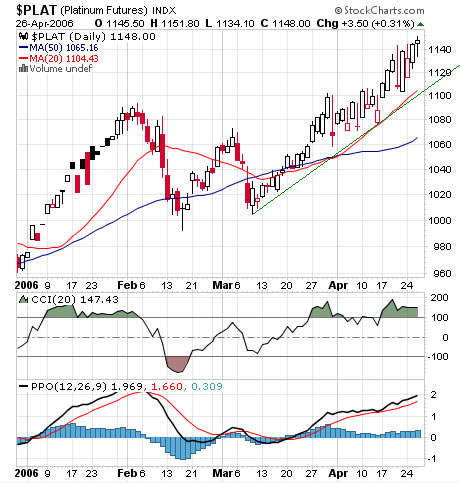
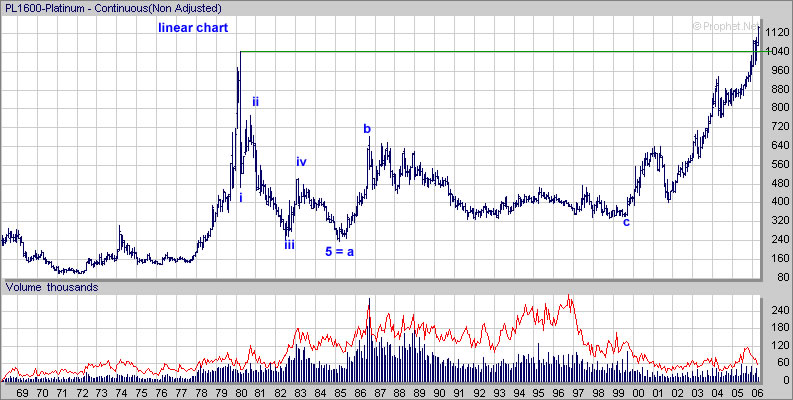
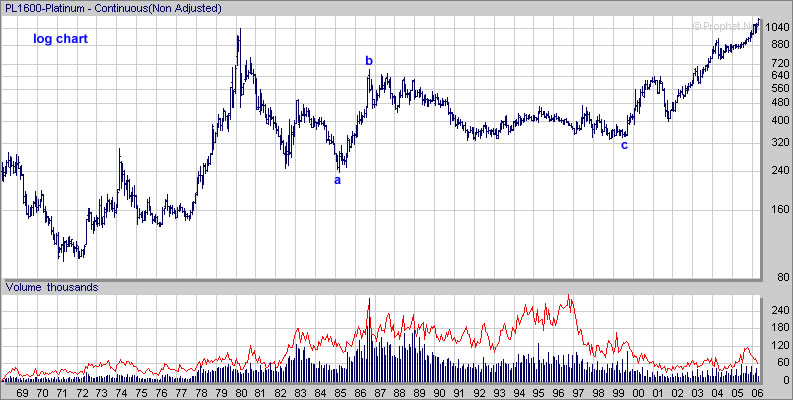
Gold & Silver spot charts
Subscribe to:
Posts (Atom)