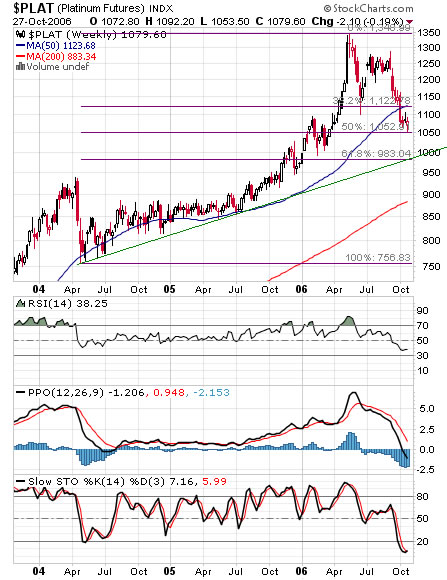
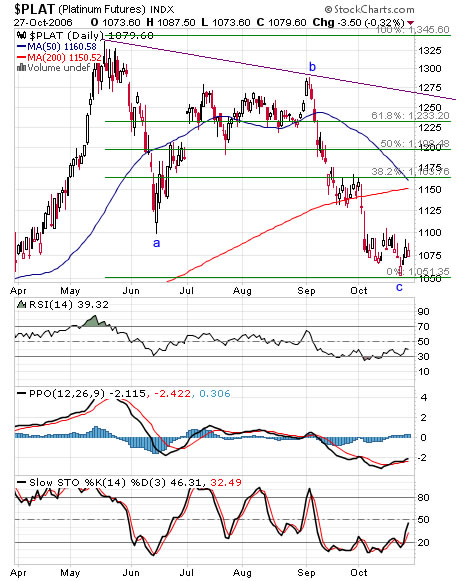
Platinum retraced 50% of the lengthy bullish wave which begun at mid 2004, the retracement took the shape of an ABC correction which is typical for correction waves. The indicators on the daily chart are slowly turning positive while the weekly charts need more time. Price is at major support, more support at the 983$ zone. Resistance at Fibonacci levels above current price.


No comments:
Post a Comment