Commodities Charts Homp Page

Saturday, March 17, 2007

Buy & Hold Commodities?

The DBC commodity ETF was listed on the AMEX at early February 2006, interestingly after a little more then a year the thing has gone nowhere!

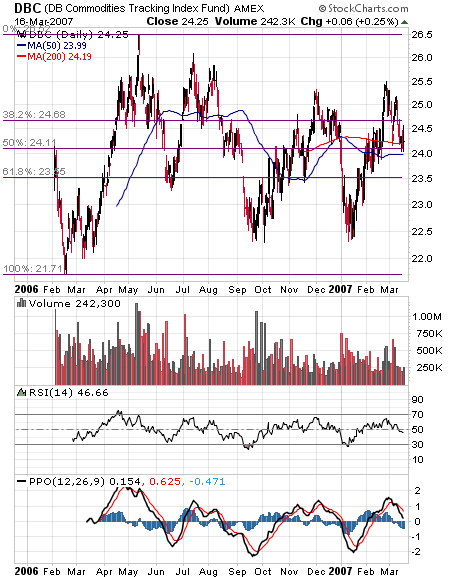
Anyone who bought the DBC at the IPO has seen little to no returns while at the same time nimble traders had several long & short trading opportunities.

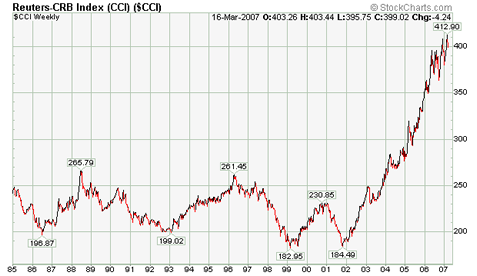
At the same time (February 2006 – March 2007) the CCI which is a broader commodity index have gained around 10%.

That’s made me thinking - Did Deutsche bank picked the wrong commodities?

Technically:

The DBC is near the 50 / 200 Moving averages and the 50% Fibonacci level. RSI is trending down below 50. The PPO is negative but still above the zero line.

dbc chart

CCI(NYBOT) long term chart

cci long term chart

Wednesday, March 07, 2007

Aluminum Chart (COMEX: AL)

Between the second quarter of 2005 and the Second quarter of 2006 the price of aluminum climbed about 66 cents per pound (0.79$ - 1.45$) for an 83% nominal gain. Note that the price took shape of five wave pattern. According to Elliott waves analysis once a five wave pattern is completed a three wave counter trend should be expected (A, B, C). I estimate that wave (c) is currently underway and a lower low then (a) should follow. The RSI indicator is trending down below 50 and PPO is slightly negative.

Aluminum chart (AL)

Thursday, March 01, 2007

Crude Oil – Update.

Interesting situation, crude May futures contracts are up about 10$ from the year bottom. The price is out of the sharp downtrend but facing horizontal resistance from current level all the way to 66$. (The 50% Fibonacci line).


Crude Oil  weekly chart

Search

Labels