Commodities Charts Homp Page
Showing posts with label NYBOT. Show all posts

Sunday, March 30, 2008

Commodities long term Top ?

In recent years most commodities had a huge run up. The Reuters CRB Continuous Commodity Index climbed more then 200%. By definition as a bull market is maturing there is less and less upward potential. I am sure there are many good reasons for commodities prices to be where they are and the outlook might seems even better but that is usually the case at cyclical top of any bull market.

Bull markets often end in a spectacular rally one in which big profits are made quickly. Have we just seen that?, Is the commodities long term top is in place ?

That's is not my point but the odds for multi month/year correction are certainly increasing.


The CCI index had surely proved itself to be the one index to follow this asset class.

CCI chart

CRB chart

Wednesday, June 20, 2007

CCI Commodities Index

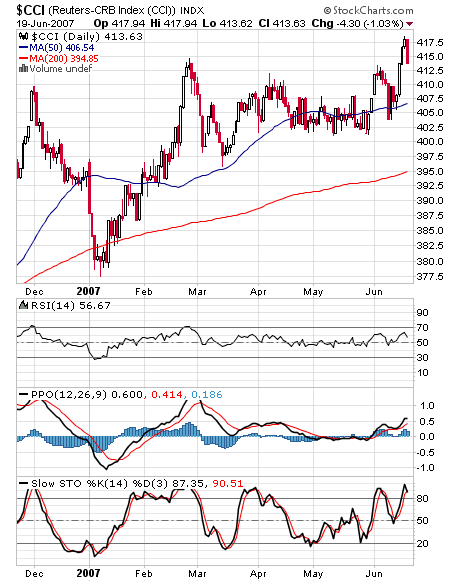
As previously explained, the CCI is the best barometer available for tracking the condition of the general commodities market. The CCI just made a new bull market high. If you are going to trade this index or any of its components be sure to study each of them both fundamentally and technically!

Long term trend support around the 50 weeks moving average.


cci chart

Short term trend line support around 402.

cci chart

Monday, April 09, 2007

The CCI Index

For all practical purposes the Continuous Commodity Index (CCI) is the preferred index for tracking the condition of the general commodities market. The reason for that is the way in which this index is calculated – The CCI Methodology.

5.88% for each of the 17 individual commodities included(Energy 17.64% : WTI Crude Oil, Heating Oil, Natural Gas, Grains 17.64% : Corn, Wheat, Soybeans, Livestock 11.76% :
Live Cattle, Lean Hogs, Softs 29.40% : Sugar, Cotton, Coffee, Cocoa, Orange Juice, Metals 23.52% : Gold, Silver, Platinum, Copper)


Here is the explanation of the CCI Methodology from the NYBOT:


The Continuous Commodity Index (CI)is weighted evenly among 17 component commodities. Each weighting is used for both arithmetic averaging of individual commodity months and for geometric averaging of the 17 commodity averages. With equal weighting, no single contract month or commodity has undue impact on the Index. The CCI uses a system of averaging all futures prices six months forward, up to a maximum of five delivery months per commodity. A minimum of two delivery months, however, must be used to calculate the current price if the second contract is outside the six-month window. Contracts in the delivery period are excluded from the calculation. Although each of the 17commodities is equally weighted, the CCI uses an average of the prices of the 17 commodities and an average of those commodities across time within each commodity. Each commodity is arithmetically averaged across time (the six-month window) and then these 17 component figures are geometrically averaged together. The continuous rebalancing provided by this methodology means the Index constantly decreases exposure to commodity markets gaining in value and increases exposure to those markets declining in value.

Saturday, August 05, 2006

Coffee Futures (NYBOT : C) - Elliott Wave Count

Coffee futures and options are trading at the New York Board of Trade (NYBOT). Coffee is one of the components of the CRB INDEX.

The price is quoted at cents per pound; contract size is 37,500 pounds for the full size contract (CK) and 12,500 pounds for the mini size contract (MK).

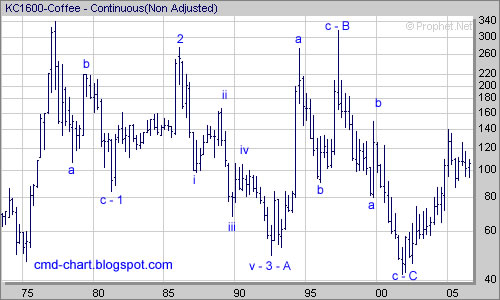
From the long term chart below we can learn that since the first half of 1977 till the second half of 2001 coffee was in a severe bear market and lost about 85% of its price.

 Coffee Futures chart

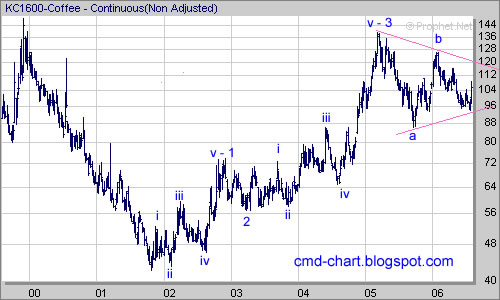
Since 2001 Coffee (like so many other commodities)is going up consistently with occasional pullbacks. I think that the 2001 bottom in the price of coffee is significant and technically coffee is positioned for a long bull market.

Short term coffee consolidates and forming a symmetrical triangle pattern, a break out one way or another should soon follow. If coffee can break above the (b) high that will indicate that the short term correction is over while a break down below the (a) low will indicate that some more consolidation is required before the continuation of the long term bull market.

Coffee Futures chart

Saturday, April 22, 2006

Orange Juice Futures (NYBOT: OJ) E – Waves count

Frozen Concentrated Orange Juice (FCOJ) futures and options on futures contracts are trading at The New York Board of Trade (NYBOT). OJ futures trading introduced in 1966, with options trading since 1985. The NYBOT FCOJ futures and options market traditionally provide critical weather risk management tools to this highly dependent commodity weather market, especially sensitive to weather conditions in Florida and Brazil.
Contract size 15,000 pounds of orange solids ( 3% more or less ) from Florida and or Brazil only.


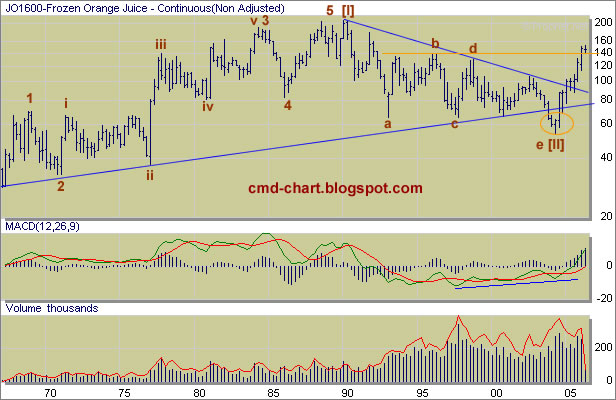
Orange Juice futures (OJ) quarterly all time chart.

Orange Juice futures (OJ) long term chart chart


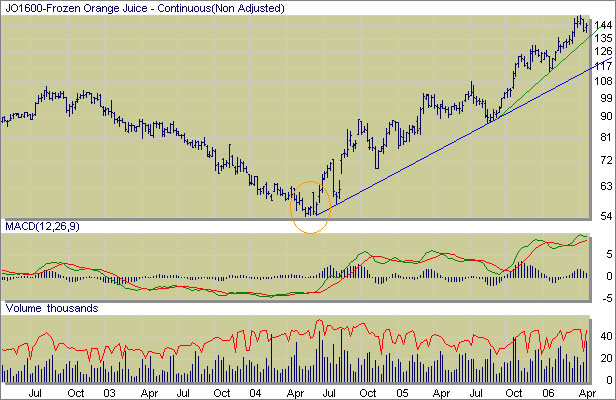
Orange Juice futures (OJ) bottom to date weekly chart.

Orange Juice futures (OJ) chart


Seems like fairly young bull market.

Wednesday, April 05, 2006

Sugar Futures #11 (SB, NYBOT)

Sugar – the Universal Commodity – is produced in over 120 countries and consumed in every country. It turns up everywhere from your coffee cup (as a food additive) to your gas tank (as the fuel additive ethanol)

Ethanol provides an alternative use for sugar crops, particularly important in markets where sugar consumption per person is unlikely to grow any further. Ethanol, as an alternative fuel, reduces dependence on imported oil and improves balance of trade flows. Ethanol aids in improving air quality and avoids problems associated with groundwater pollution.

Table sugar or sucrose is extracted from plant sources. The most important two sugar crops are sugarcane and sugar beets in which sugar can account for 12%–20% of the plant's dry weight. Some minor commercial sugar crops include the date palm, sorghum and the sugar maple.

The world sugar futures market has been around since 1914. Sugar No.11 options were introduced in 1982 as the first exchange traded commodity option.
The New York Board of Trade (NYBOT) is the designated futures market and exclusive global marketplace for Sugar No.11 futures and options on futures contracts and Sugar No.14 futures.

Contract Size: 112,000 Pounds (50 long tons).


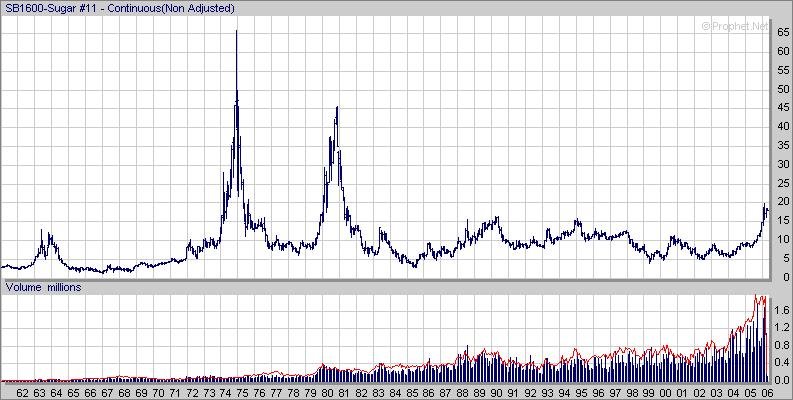
Sugar Futures #11 (SB, NYBOT) Long term chart

Saturday, March 11, 2006

Cocoa Futures (NYBOT : CC)

Cocoa is the dried and partially fermented fatty seed of the cacao tree from which chocolate is made. In the United States, 'cocoa' often refers to cocoa powder, the dry powder made by grinding cocoa seeds and removing the cocoa butter from the dark, bitter cocoa solids. By itself it has an extremely bitter flavor.

In 2004 the world production 3,607,052 MT of cocoa beans per country was assorted as follows:

1. Côte d'Ivoire (Ivory Coast) - 1,331,494 MT
2. Ghana - 736,000 MT
3. Indonesia - 430,000 MT
4. Nigeria - 366,000 MT
5. Brazil - 169,416 MT
6. Cameroon - 130,000 MT
7. Ecuador - 88,000 MT


For over 75 years, the cocoa market of the New York Board of Trade has provided the same reliable pricing functions for the world cocoa industry: price discovery, price risk transfer and price dissemination.

As a commodity with very concentrated production sources and seasonal demand cycles, cocoa presents specific price risk characteristics for candy manufacturers, cocoa importers, exporters, trade houses and producers.

Contract calls for delivery of any kind of cocoa bean- "the growth of any country or clime, including new or yet unknown growths"- as long as it meets F.D.A. standards for importation.

Deliverable Growths: The growth of any country or clime, including new or yet unknown growths. Growths are divided into three classifications: Group A, deliverable at a premium of $160/ton (including the main crops of Ghana, Nigeria, Ivory Coast, among others); Group B, deliverable at a premium of $80.00/ton (includes Bahia, Arriba, Venezuela, among others); Group C, deliverable at par (includes Sanchez*, Haiti, Malaysia and all others).

Contract Size 10 metric tons.
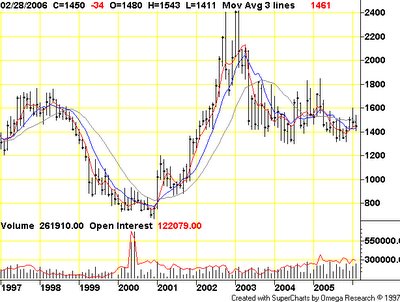
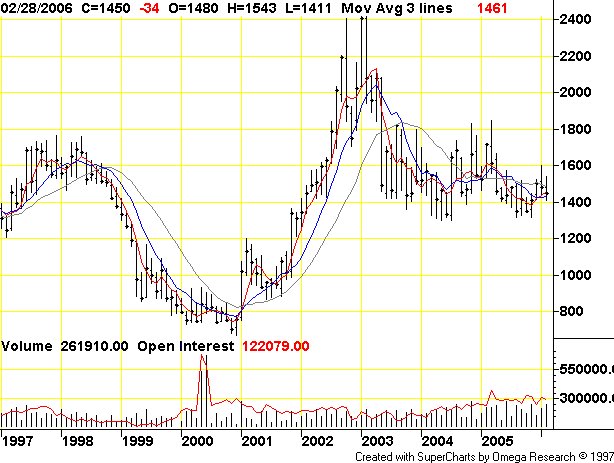
Cocoa futures NYBOT : CC

Search

Labels