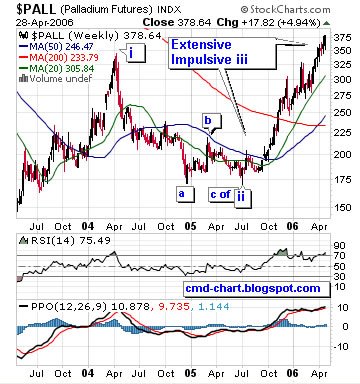
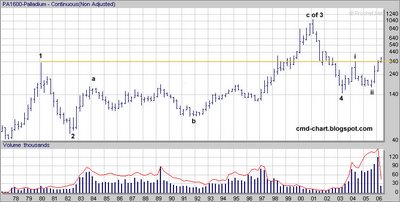
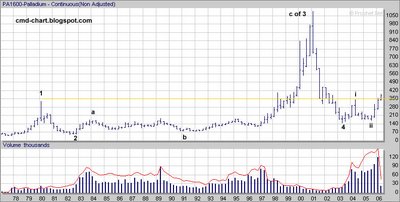
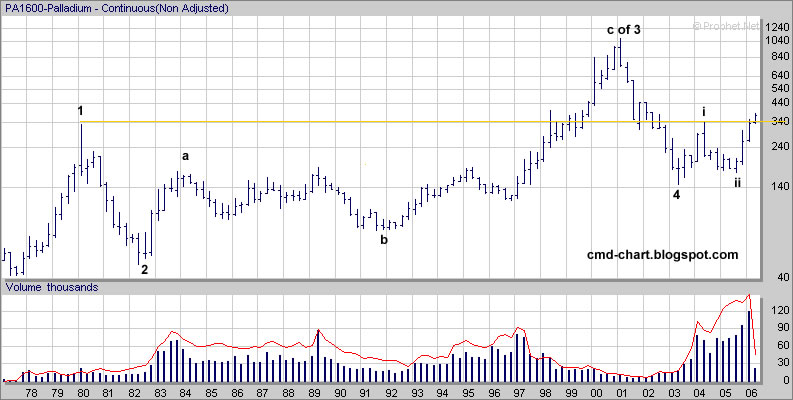
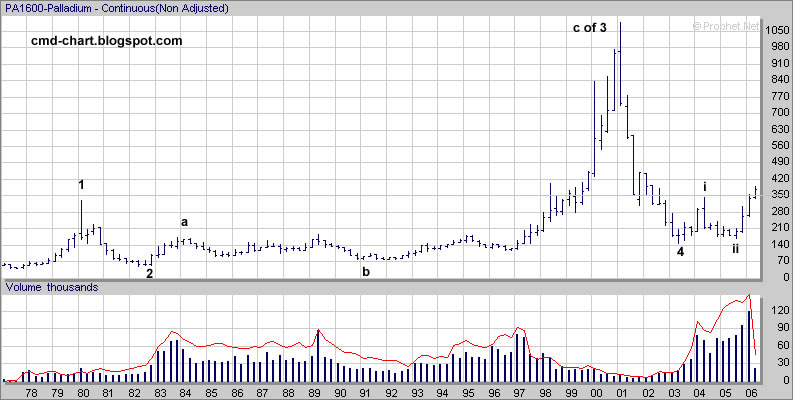
Here are three charts of palladium annotated with Elliott wave counts, the first chart is a weekly log chart. The other two are long term (30 years) quarterly palladium futures charts, log and linear. If you are new to Elliot wave read this
Free Elliot wave tutorial, if you want to know more about Elliot wave I recommend that you read
this book and try the
EWI subscription (30 days Free trail)Click on the charts below to enlarge:


No comments:
Post a Comment