Crude Oil Futures (NYMEX: CL) , USO (oil ETF) Charts
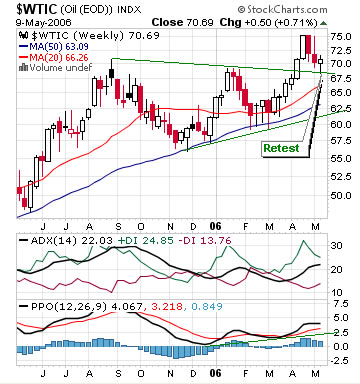
Crude Oil broke out of a triangle pattern and made a short term top at ~ 75$ it then headed back down to retest the triangle , this is technically normal and the initial price target for WTI crude oil remains ~81$ . See previous Crude Oil posts


No comments:
Post a Comment