


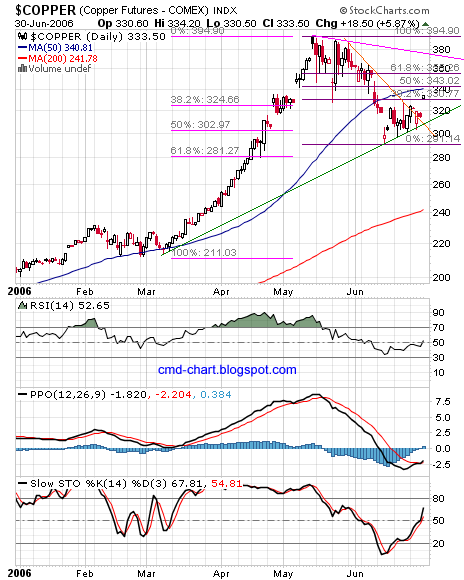
Short term bottom established at around 2.91$ per pound of copper, this price level is between the 61.8% and the 50% Fibonacci levels of the February – May 2006 wave up. The price of copper traded and closed above the diagonal downtrend resistance line (orange). Copper is currently trading above the 38.2% Fibonacci level of the May – June wave down. A new trend line (green) is visible - connecting the March and June bottoms. RSI trending up above 50, PPO on the verge of crossing over, PPO histogram slightly positive and the slow stochastic trending up above 50.
Short term support at the Fibonacci levels below the current price and at the green uptrend line. Short term resistance at the 50 DMA, the Fibonacci lines above current price and the pink downtrend line coming from May top, which is the all time high for copper.
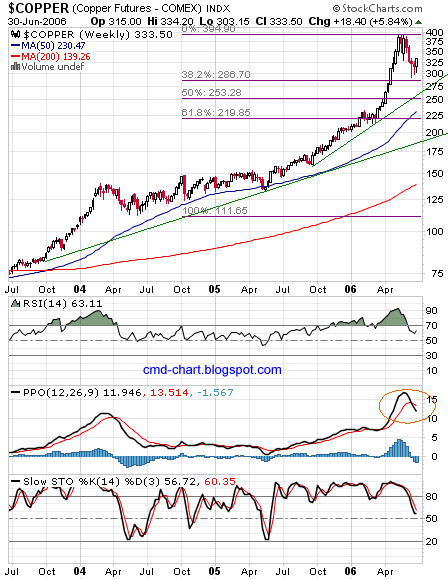
Copper Weekly Chart
The price of copper pulled back to the 38.2% Fibonacci level area of the monster up wave which started at Q2-2004. Short term bottom seems to be in place. RSI still above 50 and turning back up, PPO crossover - bearish, PPO histogram negative and stochastic trending down but still above 50 and might turn up soon.
Support on the intermediate term chart is at the Fibonacci support lines the 50 WMA (blue) and the green uptrend lines.Resistance at all time high : ~4.00$ per pound of copper.
No comments:
Post a Comment