


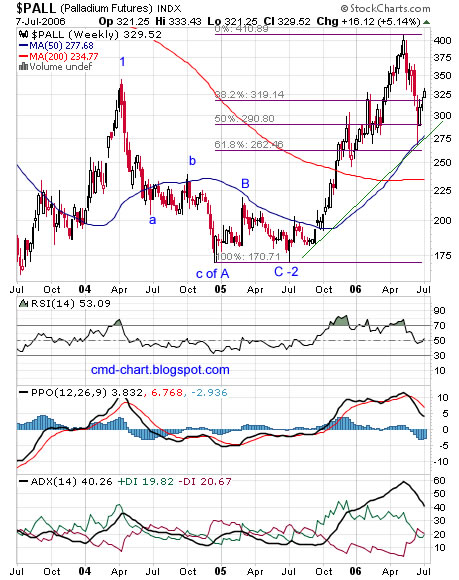
Topping out at 410$, it then pulled back roughly 61.8% of the rally to touch its 50 weeks moving average (WMA)and bottomed at 267$. Palladium lost 35% in one month!
Palladium weekly chart
The Elliott wave is unclear to me but the most likely scenario: wave three still in progress, this way or that way I think that higher highs will follow. The price of palladium is currently above the 38.2% Fibonacci line and this level should provide some support along the green uptrend line and the 50 WMA. Notice that the 200 WMA is stable and seems to turn back up. RSI turned back up above 50, PPO bearish crossover but still above zero, PPO histogram negative, ADX slightly bearish.
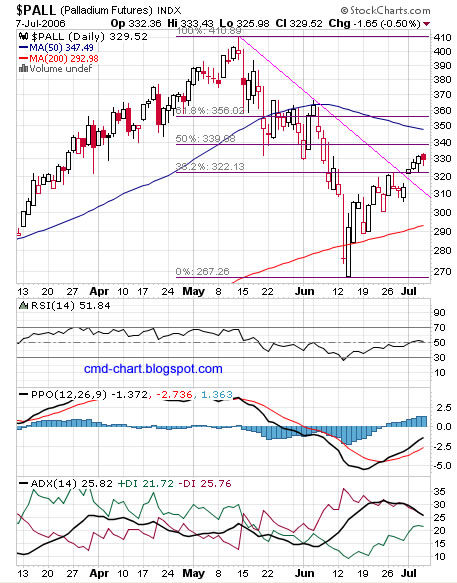
Palladium daily chart
The price of palladium broke up above the pink downtrend line and is currently above the 38.2% Fib and its 200 DMA. RSI trends up above 50, PPO bullish crossover but still below zero, PPO histogram positive, ADX improving. Support at the 38.2% Fib and the 200 DMA, the pink line probably get tested. Resistance at the Fibs above the current price, the 50 DMA and the high (410$).
Related:
Palladium long term Elliott wave count
Gold and Silver charts analysis
No comments:
Post a Comment