


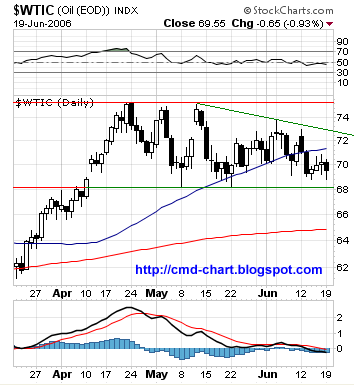
Short term (daily chart) crude oil is consolidating in a relatively tight trading range of 7$ (75$ - 68$) ,Resistance at the 50 DMA , downward diagonal line and the top of the trading range(~75$). Support at the bottom of the trading range (~68$) and the 200 DMA.
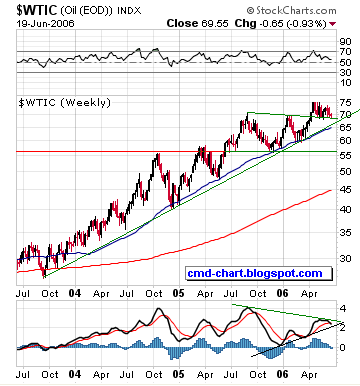
Long term (weekly chart) sustained uptrend but a bit of deceleration. Support at long term uptrend line (~67$), the 50 WMA, strong support at 56$.
Investors and traders can get direct exposure to the price of crude oil with crude oil futures and derivatives and the USO ETF. Diversified exposure to crude oil related equity can be achieved with ETFs like the XLE (Energy Select Sector SPDR) and the OIH (Oil Services Holders).
No comments:
Post a Comment