Commodities Charts Homp Page

Saturday, October 21, 2006

Natural Gas – King of volatility

Natural Gas can easily claim the title – King of volatility among tradable commodities.

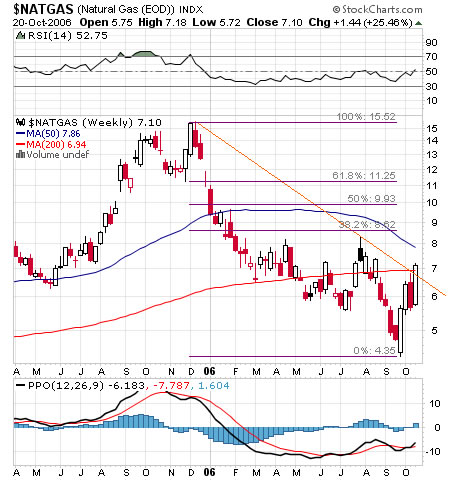
Technically, I think a major bottom is in place for natural gas. Diagonal downtrend line is broken to the upside. RSI is above 50 and the PPO looks slightly bullish.


Natural Gas weekly chart

CME and CBOT to Merge

CHICAGO, Oct. 17, 2006 – Chicago Mercantile Exchange Holdings Inc. (NYSE, NASDAQ: CME) and CBOT Holdings, Inc. (NYSE: BOT) today announced they have signed a definitive agreement to merge the two organizations to create the most extensive and diverse global derivatives exchange. The combined company, to be named CME Group Inc., a CME/Chicago Board of Trade Company, is expected to transform global derivatives markets, creating operational and cost efficiencies for customers and exchange members, while delivering significant benefits to shareholders. Corporate headquarters of the combined organization will remain in Chicago.-source

Saturday, September 16, 2006

CRB, CCI COMMODITY INDEX

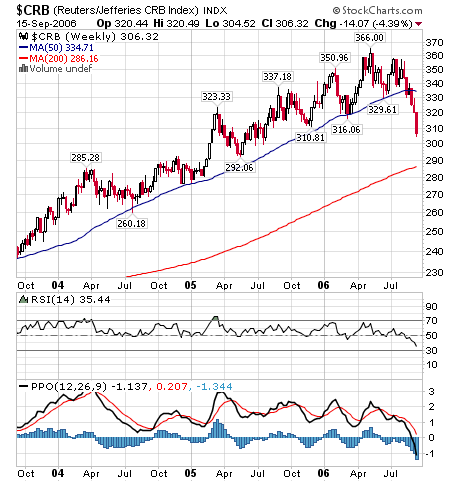
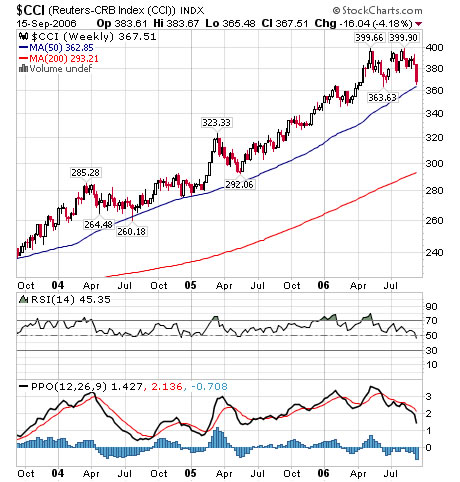
CRB/ CCI are under serious correction since around when the US FED paused the IR hikes. The FED policy seems be pretty successful – price stabilization while equity markets did not suffer much pain.

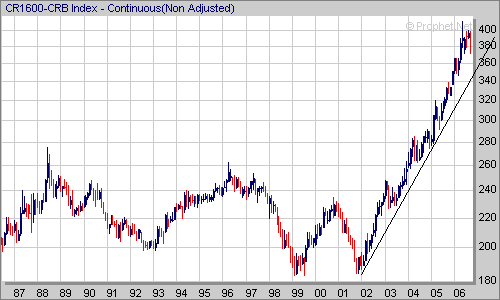
There is an interesting divergence between the CRB and CCI. Long term monthly CCI chart still look pretty good, short term the CRB has been sliding much lower then CCI.

More Info regarding CRB indexes could be found at CRBTrader.com and The New York Board of Trade NYBOT.

cci long term chart

crb weekly chart

cci weekly chart

Search

Labels