Commodities Charts Homp Page

Wednesday, May 31, 2006

Copper HG COMEX Futures

Copper is extremely parabolic. I'm sure there are excellent fundamentals for the extraordinary spike in the price of copper but technically it is extreme. On the daily chart both RSI and PPO are trending down but the price haven't pulled back much. Copper is forming some kind of triangle pattern and pattern resolution should soon follow. The weekly charts tells a different story , RSI and PPO looks pretty good and the pattern still looks reasonably bullish. Copper haven't necessarily seen its top yet.

Copper Hg comex Futures daily chart

Copper Hg comex weekly chart

Copper Futures , Comex : HG long term chart


Browse this blog archive

See Gold, Silver, Metals mining stocks

Jim Rogers International Commodity Index

It is almost impossible to run a blog about commodities without reminding Jim Rogers – a living legend in our modern investment / trading world.

Much has been said about Jim Rogers who made his fortune as a Soros Quantum fund partner. Mr. Jim Rogers developed the Rogers International Commodity Index (RICI) which tracks the price of 35 commodities futures from Crude Oil through Gold and Silk. Since November 2005 the Rogers International Commodity Index is tracked by the Rogers TRAKRS contract which trades at the Chicago Mercantile Exchange – CME.

Jim Rogers is the Author of three books:

Hot Commodities: How Anyone Can Invest Profitably in the World's Best Market.


Adventure Capitalist: The Ultimate Road Trip.


Investment Biker: Around the World with Jim Rogers.

Listen to Jim Rogers Interview - HoweStreet.com

Tuesday, May 30, 2006

Commodities News

Tokyo Commodity Exchange and Shanghai Futures Exchange sign MOU

The Tokyo Commodity Exchange (TOCOM) and Shanghai Futures Exchange (SHFE), two leading futures exchanges in Asia for metals, energy and rubber signed a Memorandum of Understanding (MoU) in Shanghai on May 26, 2006 to share information and establish a future cooperative framework. This occurred just before the 3rd Shanghai Derivatives Market Forum hosted by SHFE. -source


Eramet to invest $1.5 bln in Indonesian project

AKARTA, May 30 (Reuters) - French nickel miner Eramet said on Tuesday it plans to invest around $1.5 billion to develop the Weda Bay nickel project in eastern Indonesia.

Earlier this month, Eramet acquired nearly all shares of Toronto-listed Weda Bay Minerals Inc. The main investor in Indonesia's PT Weda Bay Nickel. Indonesian nickel producer PT Antam owns 10 percent of the Weda Bay project. -source

CRB Commodity Index chart

Saturday, May 27, 2006

Crude Oil Futures WTI Elliott Wave Analysis

Crude is trading in a rising channel for more then four years.
The Oil WTI wave is complex, Impulsive and Hyper Extensive, Bull wave that can easily extend even further and continue for several years without serious correction. I will not be in a hurry to call the top for crude oil as the chart is nowhere near to suggest that. Crude Oil is an important corner stone in this great global commodity bull market. Some clumsy reporters like to mistakenly call it the black gold – it is an oxymoron!

So.. Looking at the weekly chart it easy to see that the pullbacks have been modest since the bull cycle started late 2001. The channel is intact and the price has room to move in both directions. On the daily chart again partial wave count with the next move likely to be wave 3 up to new all time high , I would like to remind the number 81$ as an initial target , partial profit taking suggestion.

Click charts to enlarge:


Crude Oil Futures WTI daily chart

Crude Oil Futures WTI weekly chart

Friday, May 26, 2006

Soybeans Futures (S) Elliott Wave Count Analysis

Soybeans Futures contracts and soybeans Options on futures contracts are trading at the Chicago Board of Trade (CBOT). Contract Size = 5,000 bushels. Like Oats Futures (O) I notice steep Volume decline since the nineties. - If anyone can contribute more info regarding Soy beans please add comment or send email

You can click on the chart to enlarge:

Soybeans Futures (S) Long term chart

Thursday, May 25, 2006

GFMS Base Metal Index Waves Analysis

GFMS base metal index is based on the official London Metal Exchange - LME - cash settlement price for primary aluminium, copper, lead, nickel, tin and zinc. The index is an average of the six prices with equal weighting given to each of the six metals. The index is based on January 4th 2000 = 100.


Click on the chart below to enlarge
GFMS Base Metal Index Chart

Tuesday, May 23, 2006

Oats Futures (O) CBOT

Oats Futures contracts and Options on Futures are trading at the Chicago Board of Trade (CBOT). Contract size is 5,000 bushels No. 2 Heavy and No. 1 at par. For more details See CBOT.

Technically, Oats futures contracts are currently trading at the same nominal price like 1975 !

The Elliott wave count is quite odd, however that the best I could do, If you have another wave count please send it to me. If you need a basic Elliott Wave tutorial see EWI (might need registration)

If you look at the logarithmic chart the triangle pattern is not yet broken to the upside. Whereas On the linear oats futures chart the triangle is already broken to the upside.

Oats Futures Long term logarithmic Chart

Oats Futures Long term linear Chart

Sunday, May 21, 2006

Rough Rice Futures

Rough Rice Futures and Options on Futures are trading at the Chicago Board of Trade (CBOT). Contract size is 2,000 hundredweight (cwt.) of U.S. No. 2 or better long grain rough rice. For more details See CBOT


Rough Rice Futures chart

Friday, May 19, 2006

Rhodium price chart

Rhodium spot price chart

Rhodium arrows toward $7 000
19/05/2006 12:37 PM

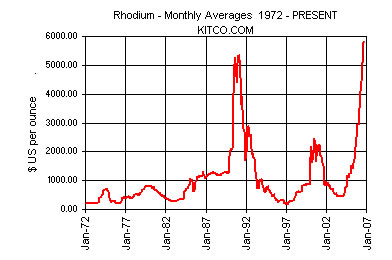
London - Rhodium jumped to a 26-year high on Friday due to endemic supply tightness, and prices look set to exceed 1980's all-time record of $7 000 an ounce soon.
Traders said an already tight market for rhodium, used in the manufacture of autocatalysts and in glass-making, was being squeezed further by speculators buying a metal that has jumped 105% this year.

"Definitely it will hit that historic high soon. How high can it go - who knows?" a trader said.

Spot rhodium was at $6 150/$6 250 an ounce, having sped higher from last week's $5 300/5 400 without interruption.

Apart from a mid-2000 price peak, rhodium has been in the doldrums for most of the last 25 years, trading as low as $190 in 1997.

Demand for LCD's

But demand is growing strongly, with plasma LCD (liquid crystal display) glass-makers the latest boom sector, and supply cannot keep up.

"It is quite simple, demand has been good for the last few years and stocks have been run down," another trader said.

Earlier this week top refiner Johnson Matthey, in its annual review of platinum metals, highlighted the strong fundamental picture as demand rose sharply during 2005, further outpacing supplies and widening the market's deficit.

"With demand for rhodium growing by more than twice the rate of increase in supplies, the market moved to a deficit of 58 000 ounces," Johnson Matthey said.

Consumption rose to 812 000 ounces in 2005, equalling the 2000 record, up from 2004's 729 000 ounces as use in autocatalysts, glass and chemical applications rose.

Supply rose by 5% to 754 000 ounces from 2004's 720 000, with South African output climbing 7% to 627 000 ounces. -source

Stephen Roach try to talk down commodities...

Stephen Roach - Morgan Stanley Chief Economist try to talk down commodities, will it work? - I don't think so... It amaze me that all those highly "educated" economists fail to understand that higher commodities prices are exactly what it takes to reduce demand and increase supply.

05-18-06 03:17 PM EST
BOSTON (Dow Jones) -- Morgan Stanley Chief Economist Stephen Roach thinks there's a speculative bubble in commodities, and it's not a matter of if it will burst, but when.
"Asset bubbles have dominated financial market experience over the past six years," Roach wrote in a note to clients earlier this week, pointing to the initial bounce in stocks followed by runs in bonds, real estate and derivatives.
"Like clockwork, liquidity-driven investors have migrated from asset to asset, desperately in search of yield," he said. "The world is now in the midst of another bubble -- this one in commodities."
The economist said the jumps in prices of materials the past few months are reminiscent of charts of dot-com stocks in late 1999 and 2000.
"That speaks to an important aspect of any speculative bubble -- price excesses that spread into the far reaches of an asset class."
Last week gold futures hit a high of $728 an ounce, their highest level in almost 26 years, but since then metals have suffered a sharp and unsettling three-day pullback. - source

Crude OIL WTI Elliott wave count ; USO AMEX ETF

Crude Oil - one of the most important commodities if not the most important. Since the USO ETF(United States Oil Fund Lp)IPO Investors or stock traders can get direct exposure to the price of WTI crude oil.

Crude OIL WTI Elliott wave count chart

USO ETF(United States Oil Fund Lp)chart

Thursday, May 18, 2006

CRB commodity index & DBC commodity ETF

I read a lot of bearish comments about commodities and gold, some even claiming it's a commodity bubble. Let's look at the charts (the facts):

Short term (daily chart) the CRB commodity index is correcting a little bit:

CRB commodity index chart

Long term (weekly chart), do you see the trend? , yes it's clearly up:

CRB commodity index chart


Deutsche Bank has done a good job with its DBC commodity ETF. Since the DBC IPO (February 2006) the DBC outperformed the CRB commodity index. DBC tracks the DBLCI index (Crude Oil, Heating Oil, Gold, Aluminum, Corn and Wheat)

Deutsche Bank commodity ETF, DBC vs CRB commodity index chart


Investors who don’t trade futures contracts might use the DBC ETF to get direct exposure to commodity prices.

Tuesday, May 16, 2006

Platinum, Palladium, Rhodium, Ruthenium & Iridium Supply Demand Analysis Report

Johnson Matthey precious metals division has published a detailed report regarding the Platinum group metals (PGM). The report includes detailed supply demand analysis for: Platinum, Palladium, Rhodium, Ruthenium & Iridium - link

Wednesday, May 10, 2006

Crude Oil Futures (NYMEX: CL) , USO (oil ETF) Charts

Crude Oil broke out of a triangle pattern and made a short term top at ~ 75$ it then headed back down to retest the triangle , this is technically normal and the initial price target for WTI crude oil remains ~81$ . See previous Crude Oil posts

Crude Oil Futures (NYMEX: CL) chart

Crude Oil Futures (NYMEX: CL) long term chart

US Oil Fund, USO ETF chart

Tuesday, May 09, 2006

Investors Held $120 Bln in U.S. Commodities, Citigroup Says

May 9 (Bloomberg) -- Investors and speculators held more than $120 billion of bets in U.S. commodities markets in April, the second-highest amount on record, helping to drive up prices of raw materials from oil to copper, Citigroup Inc. said.
Speculators held about $30.3 billion in natural gas bets, and $30.1 billion in oil bets, out of the 36 commodities studied, Citigroup analyst Alan Heap said in a May 5 report. The two commodities accounted for 47 percent of the bets held, followed by gold at 17 percent, or $13.3 billion, and copper 3 percent.
Investors worldwide are buying commodity-linked indexes and futures, seeking to beat returns from stocks and bonds as concern about raw material shortages pushes oil and copper to records. Global investments in commodity funds totaled about $200 billion in February, Heap had said then.
``We believe the hike in speculative positions has been a key driver for the latest surge in commodity prices,'' Heap said in the report.
Crude oil in New York has risen 15 percent this year, and gold has soared 31 percent. Copper futures prices in New York have jumped 72 percent this year. By contrast, the Standard and Poor's 500 Index of stocks has gained 6.1 percent.

Saturday, May 06, 2006

Frozen Pork Bellies Futures (CME: PB) Elliott Wave count

Frozen Pork Bellies Futures and Options on Futures are trading at the Chicago Mercantile Exchange(CME).

Contract Size = 40,000 pounds of frozen pork bellies, cut and trimmed.

Frozen Pork Bellies Futures (CME: PB) Elliott Wave count long term price chart


Frozen Pork Bellies Futures long term log chart

Monday, May 01, 2006

Palladium Futures (PA, NYMEX) Charts & Waves

Here are three charts of palladium annotated with Elliott wave counts, the first chart is a weekly log chart. The other two are long term (30 years) quarterly palladium futures charts, log and linear. If you are new to Elliot wave read this Free Elliot wave tutorial, if you want to know more about Elliot wave I recommend that you read this book and try the EWI subscription (30 days Free trail)

Click on the charts below to enlarge:
Palladium Futures (PA, NYMEX) chart

Palladium Futures (PA, NYMEX) long term log chart

Palladium Futures (PA, NYMEX) long term linear chart

Search

Labels