skip to main
|
skip to sidebar
Archive
▼
2012
(1)
▼
October
(1)
Crude oil prediction and Iran
►
2008
(4)
►
December
(1)
►
June
(1)
►
March
(1)
►
January
(1)
►
2007
(20)
►
August
(1)
►
July
(3)
►
June
(2)
►
May
(1)
►
April
(7)
►
March
(3)
►
February
(2)
►
January
(1)
►
2006
(100)
►
November
(2)
►
October
(3)
►
September
(1)
►
August
(2)
►
July
(7)
►
June
(11)
►
May
(17)
►
April
(14)
►
March
(8)
►
February
(15)
►
January
(20)
Gold Global Perspective
Gold & Silver Stocks
Contact @
Showing posts with label
Unleaded Gas
.
Show all posts
Showing posts with label
Unleaded Gas
.
Show all posts
Friday, April 14, 2006
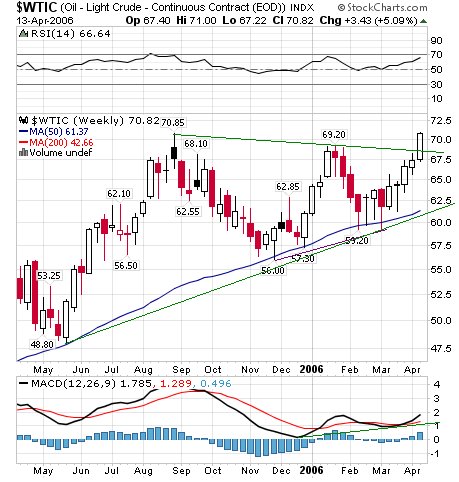
New all time high for crude oil (WTI) , Energy charts
The continuous crude oil futures closed the week at new all time nominal high. The triangle pattern initial target is ~ 81$.
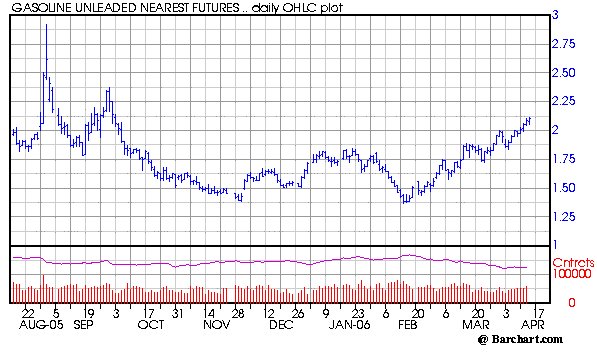
Unleaded Gasoline futures price is around 30% lower then 2005 highs.
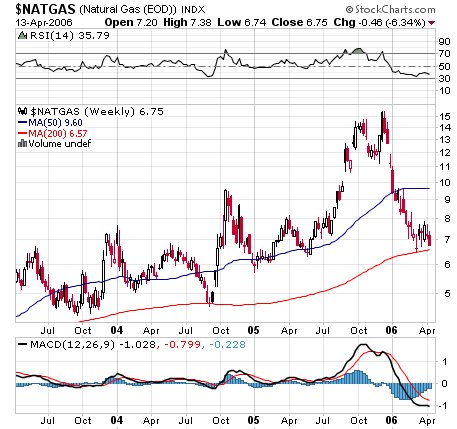
Natural gas futures are trading about 50% lower then 2005 highs.
Sunday, January 22, 2006
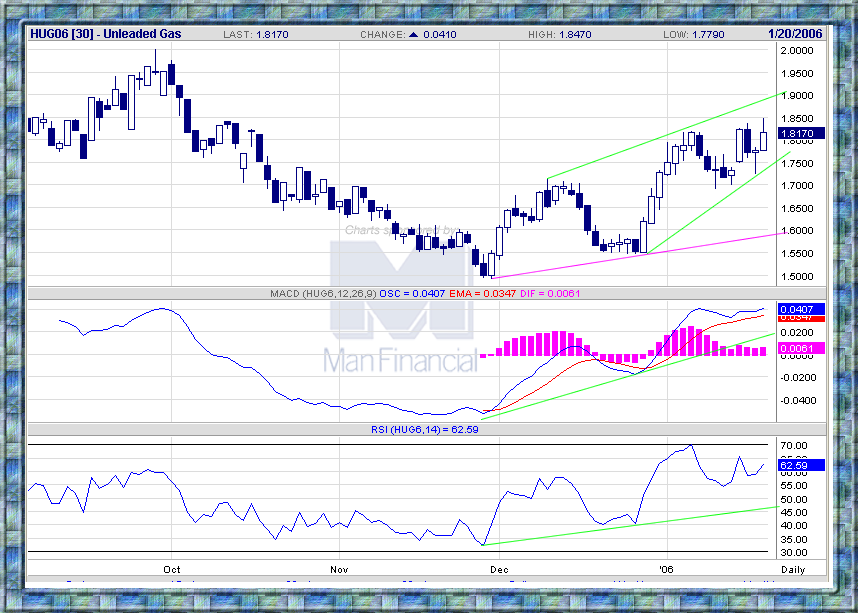
Unleaded Gas Futures
Older Posts
Home
Subscribe to:
Posts (Atom)
Search
Labels
Aluminum
(6)
CBOT
(6)
CCI
(6)
China
(2)
CME
(5)
Cocoa
(1)
Coffee
(1)
COMEX
(5)
Commodity ETF
(14)
Copper
(14)
Corn
(1)
Cotton
(1)
CRB
(10)
Crude Oil
(22)
DBC
(5)
DBLCI
(2)
Elliott Wave
(18)
Frozen Pork Bellies
(1)
GFMS
(1)
Global Demand
(1)
Gold
(1)
Goldman Sachs
(1)
GSCI
(1)
Heating Oil
(1)
India
(2)
Iran
(1)
Iridium
(1)
Jim Rogers
(1)
LBCI
(1)
Lead
(1)
Lehman Brothers
(1)
Live Cattle
(1)
LME
(4)
Lumber
(1)
Marc Faber
(1)
Margins
(1)
MCX
(1)
Mines
(4)
Mining Laws
(3)
Molybdenum
(1)
Mongolia
(1)
Natural Gas
(5)
Nickel
(3)
NYBOT
(8)
NYMEX
(13)
Oats
(1)
Orange Juice
(1)
Palladium
(11)
Penny
(1)
Platinum
(12)
Propane
(1)
Rhodium
(3)
Rice
(2)
RICI
(1)
Russia
(2)
Ruthenium
(1)
Silver
(3)
Soybeans
(1)
Stephen Roach
(1)
Sugar
(1)
Tanzania
(1)
Tin
(1)
TOCOM
(2)
TRAKERS
(1)
Unleaded Gas
(2)
Uranium
(1)
USO
(4)
Venezuela
(1)
Video
(1)
Wheat
(1)
World Bank
(1)
Xetra
(1)
Zinc
(3)
Commodities Charts