Commodities Charts Homp Page
Showing posts with label Nickel. Show all posts

Thursday, July 20, 2006

Dow Jones-AIG Industrial Metals Index

Dow Jones-AIG Industrial Metals Index includes: Aluminum, Copper, Zinc and Nickel.

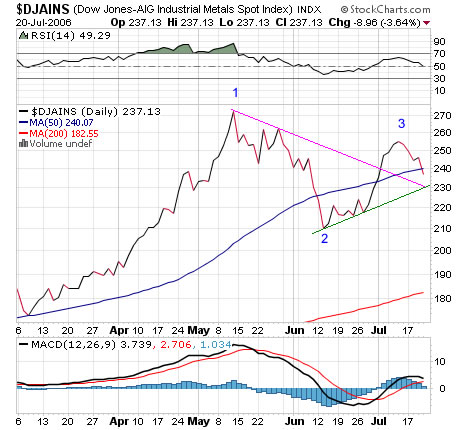
The Indexed topped at mid 2006 ( top labeled 1) and lost 60 points or about 23% by mid June a bottom (labeled 2) was made and the index climbed higher to recoup most of decline.

Currently the index is trading just below the 50 daily moving average (DMA), RSI trending down, PPO still positive but seems to be ready to turn back down. Short term support at 230 - where the green and pink lines cross each other. Failure to hold the 230 level will indicate that the correction is not over and lower low (lower then 2) will follow. A successful retest of the 230 level will indicate the correction is over and higher highs should be expected.

Dow Jones-AIG Industrial Metals Index chatr

Monday, July 10, 2006

Nickel at New All Time High

While some well paid economists, market commentators , journalists and other creatures are working extra hours to convince you that metals and the general commodities markets are simply bubble - nickel quietly front running the pack to make a new all time high of 25,500 USD per metric ton. Nickel futures and options are trading at the London metal exchange (LME).

Nickel Chart LME


One good reason for the new high might be collapsing stockpiles.


Nickel stockpiles Chart

Thursday, May 25, 2006

GFMS Base Metal Index Waves Analysis

GFMS base metal index is based on the official London Metal Exchange - LME - cash settlement price for primary aluminium, copper, lead, nickel, tin and zinc. The index is an average of the six prices with equal weighting given to each of the six metals. The index is based on January 4th 2000 = 100.


Click on the chart below to enlarge
GFMS Base Metal Index Chart

Search

Labels