Commodities Charts Homp Page
Showing posts with label CRB. Show all posts

Tuesday, December 02, 2008

CRB Chart

During the last several month commodities had a huge correction . In my opinion - not much downside is left(If any) and speculative shorting should be avoided.
The only question is which commodities are the best buying opportunity?

crb long term chart

Sunday, March 30, 2008

Commodities long term Top ?

In recent years most commodities had a huge run up. The Reuters CRB Continuous Commodity Index climbed more then 200%. By definition as a bull market is maturing there is less and less upward potential. I am sure there are many good reasons for commodities prices to be where they are and the outlook might seems even better but that is usually the case at cyclical top of any bull market.

Bull markets often end in a spectacular rally one in which big profits are made quickly. Have we just seen that?, Is the commodities long term top is in place ?

That's is not my point but the odds for multi month/year correction are certainly increasing.


The CCI index had surely proved itself to be the one index to follow this asset class.

CCI chart

CRB chart

Monday, January 15, 2007

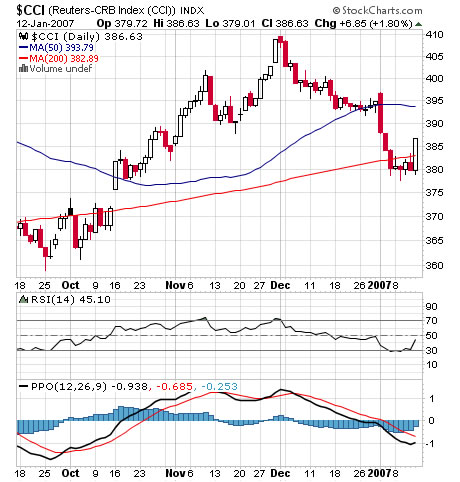
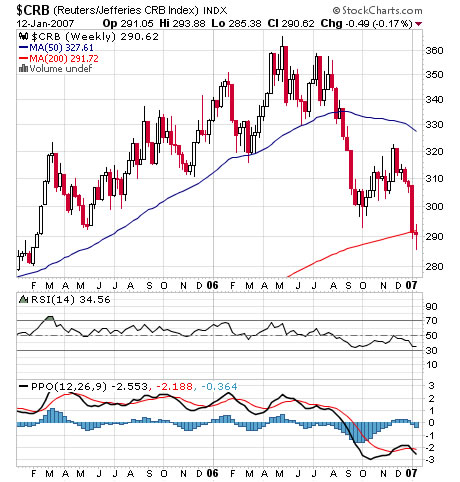
Commodity Indices CRB vs. CCI Part 2

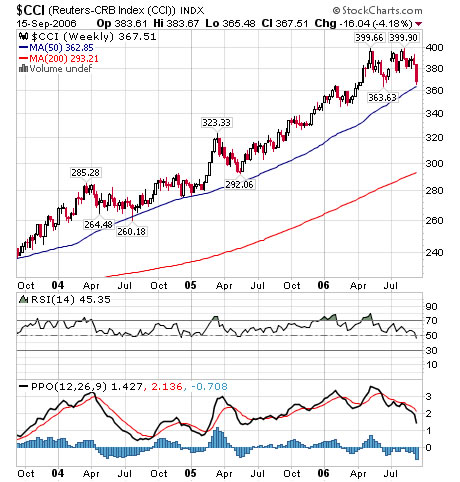
At September 2006 I have posted about an interesting divergence between the CRB and CCI commodity indices. The divergence has extended much farther and the CCI methodology have proved to be better (see the CCI & CRB weekly charts below), at least from for capital appreciation point of view. It appears that crude oil and crude oil derivatives commodities are weighted heavily in the CRB and other propriety indices.

Going forward commodities investors should be cautious as some commodities are at a point they can easily decline by up to 50%. It is my opinion that the commodities markets will be more difficult this year with increased divergence (between different commodities) and higher volatility.


CCI Index chart


CRB Index chart

Saturday, September 16, 2006

CRB, CCI COMMODITY INDEX

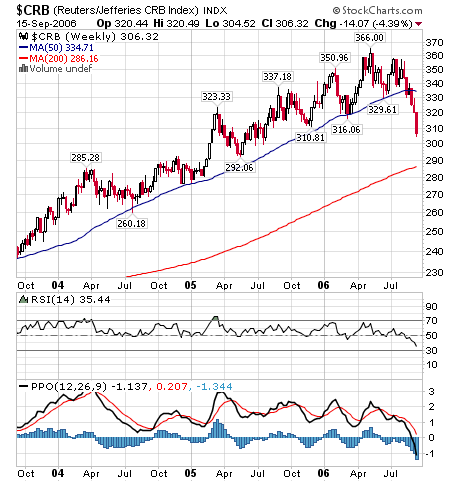
CRB/ CCI are under serious correction since around when the US FED paused the IR hikes. The FED policy seems be pretty successful – price stabilization while equity markets did not suffer much pain.

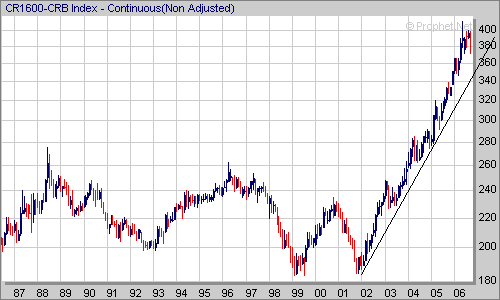
There is an interesting divergence between the CRB and CCI. Long term monthly CCI chart still look pretty good, short term the CRB has been sliding much lower then CCI.

More Info regarding CRB indexes could be found at CRBTrader.com and The New York Board of Trade NYBOT.

cci long term chart

crb weekly chart

cci weekly chart

Thursday, May 18, 2006

CRB commodity index & DBC commodity ETF

I read a lot of bearish comments about commodities and gold, some even claiming it's a commodity bubble. Let's look at the charts (the facts):

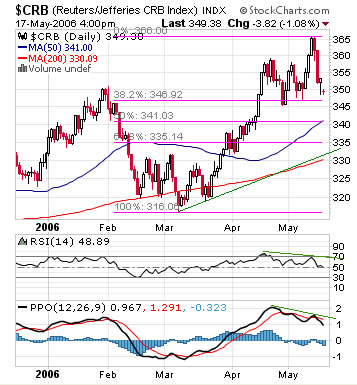
Short term (daily chart) the CRB commodity index is correcting a little bit:

CRB commodity index chart

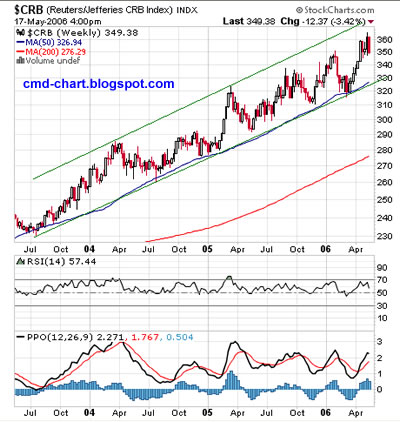
Long term (weekly chart), do you see the trend? , yes it's clearly up:

CRB commodity index chart


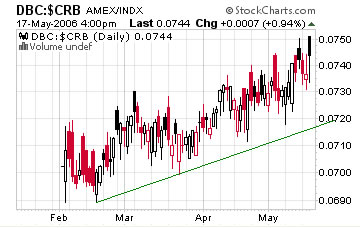
Deutsche Bank has done a good job with its DBC commodity ETF. Since the DBC IPO (February 2006) the DBC outperformed the CRB commodity index. DBC tracks the DBLCI index (Crude Oil, Heating Oil, Gold, Aluminum, Corn and Wheat)

Deutsche Bank commodity ETF, DBC vs CRB commodity index chart


Investors who don’t trade futures contracts might use the DBC ETF to get direct exposure to commodity prices.

Friday, April 07, 2006

Commodity Research Bureau (CRB) Index review

The “RJ/CRB” is an Index of 19 commodity futures prices, Commodity Research Bureau (CRB) Index was originally developed in 1957, continues to be one of the most often cited indicators of overall commodity prices.


Index Components (alphabetical order) :

1. Aluminum (6%)
2. Cocoa (5%)
3. Coffee (5%)
4. Copper (6%)
5. Corn (6%)
6. Cotton (5%)
7. Crude oil (23%)
8. Gold (6%)
9. Heating oil (5%)
10. Lean Hogs (1%)
11.Live cattle (6%)
12. Natural Gas (6%)
13. Nickel (1%)
14. Orange juice (1%)
15. Silver (1%)
16. Soy beans (6%)
17. Sugar (5%)
18. Unleaded Gas (5%)
19. Wheat (1%)


The New York Board of Trade (NYBOT) began trading the CRB in 1986; the name of the index changed to the Reuters CRB Index in 2001. Now again renamed and sponsored as the Reuters/Jefferies CRB Index..

The NYBOT also offers futures and options contracts on the Continuous Commodity Index (CCI) , representing the ninth revision (as of 1995) of the original Commodity Research Bureau (CRB) Index. The CCI Index consists of 17 commodity futures prices.

The RJ/CRB and CCI futures and options contracts, traded exclusively in the NYBOT index market place, offer investors direct access to an alternative asset class that may diversify their holdings.

For in dept overview regarding weighting factors adjustments and Index Chronology See NYBOT.

CRB Index Chart

Thursday, February 23, 2006

CRB commodities index

The CRB commodities index is again nearing its 50 weeks moving average which proved itself to be a good buying opportunity the last couple of years.

Click on the chart below to enlarge:

CRB commodities index

Tuesday, January 31, 2006

Wednesday, January 18, 2006

Monday, January 02, 2006

Search

Labels