Commodities Charts Homp Page
Showing posts with label Aluminum. Show all posts

Wednesday, March 07, 2007

Aluminum Chart (COMEX: AL)

Between the second quarter of 2005 and the Second quarter of 2006 the price of aluminum climbed about 66 cents per pound (0.79$ - 1.45$) for an 83% nominal gain. Note that the price took shape of five wave pattern. According to Elliott waves analysis once a five wave pattern is completed a three wave counter trend should be expected (A, B, C). I estimate that wave (c) is currently underway and a lower low then (a) should follow. The RSI indicator is trending down below 50 and PPO is slightly negative.

Aluminum chart (AL)

Thursday, July 20, 2006

Dow Jones-AIG Industrial Metals Index

Dow Jones-AIG Industrial Metals Index includes: Aluminum, Copper, Zinc and Nickel.

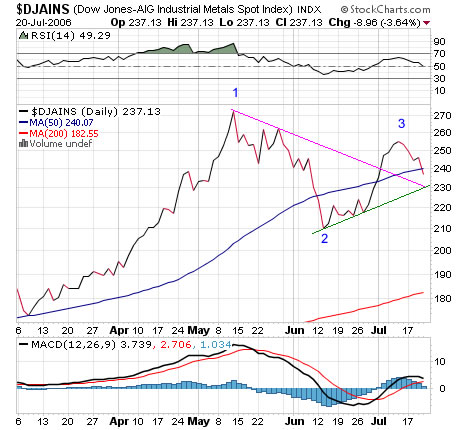
The Indexed topped at mid 2006 ( top labeled 1) and lost 60 points or about 23% by mid June a bottom (labeled 2) was made and the index climbed higher to recoup most of decline.

Currently the index is trading just below the 50 daily moving average (DMA), RSI trending down, PPO still positive but seems to be ready to turn back down. Short term support at 230 - where the green and pink lines cross each other. Failure to hold the 230 level will indicate that the correction is not over and lower low (lower then 2) will follow. A successful retest of the 230 level will indicate the correction is over and higher highs should be expected.

Dow Jones-AIG Industrial Metals Index chatr

Thursday, May 25, 2006

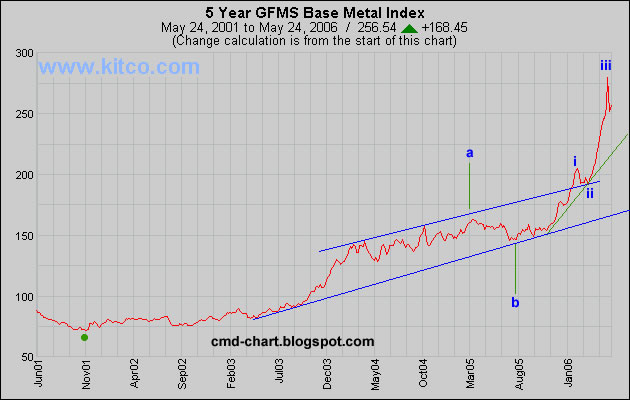
GFMS Base Metal Index Waves Analysis

GFMS base metal index is based on the official London Metal Exchange - LME - cash settlement price for primary aluminium, copper, lead, nickel, tin and zinc. The index is an average of the six prices with equal weighting given to each of the six metals. The index is based on January 4th 2000 = 100.


Click on the chart below to enlarge
GFMS Base Metal Index Chart

Sunday, April 02, 2006

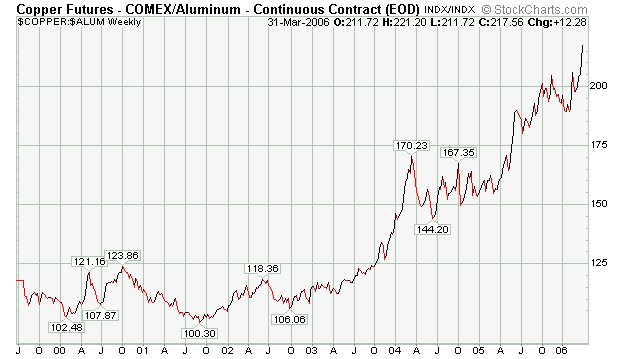
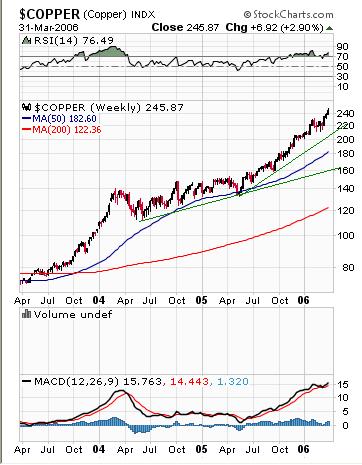
Copper High Grade (HG, Comex) & Aluminum (AL, COMEX)

Aluminum is a partial substitute for copper; currently copper is more then two times more expensive then the same weight of aluminum. Aluminum is also a component of the Deutsche-bank commodities index DBLCI which is tracked by the DBC ETF.


copper aluminum ratio chart
Copper High Grade (HG, Comex) chart
Aluminum (AL, COMEX) chart

Thursday, February 16, 2006

Aluminum Futures

Aluminum is the chemical element in the periodic table that has the symbol Al and atomic number 13. It is a silvery and ductile member of the poor metal group of chemical elements.
Aluminum is a symbol of the 21st century economy. The lightweight, corrosion resistant metal is ubiquitous, finding use in aerospace applications, as a construction material, in packaging, automobiles, railroad cars, and thousands of other applications.

Transportation is the largest single consuming sector, absorbing approximately 30% of U.S. production. Packaging and aluminum containers – all those cans – take another 20%; building and construction absorbs 10%. The high voltage electric transmission lines that are strung from one end of the nation to the other are often made of aluminum.

Aluminum scrap is among the most easily recycled metal available today. In the United States, the recycling of aluminum cans is a billion-dollar business by itself. Practically all beverage containers made in the United States today are aluminum and two-thirds are recycled. The turnaround between the time a can is tossed into a recycling bin, re-smelted, fabricated and back on a store shelf is often only 60 days.

Aluminum production is dependent on a large supply of uninterrupted electric power and energy is a key cost component.

The Exchange's COMEX Division aluminum futures and options contracts provide price transparency to the U.S. aluminum market, valued at about $35 billion per year in products and exports.

Trading Unit 44,000 pounds of aluminum.
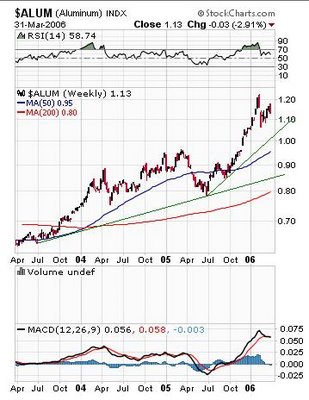
Aluminum (AL, COMEX) chart

Sunday, January 15, 2006

Search

Labels