Showing posts with label CBOT. Show all posts
Showing posts with label CBOT. Show all posts
Saturday, October 21, 2006
CME and CBOT to Merge
CHICAGO, Oct. 17, 2006 – Chicago Mercantile Exchange Holdings Inc. (NYSE, NASDAQ: CME) and CBOT Holdings, Inc. (NYSE: BOT) today announced they have signed a definitive agreement to merge the two organizations to create the most extensive and diverse global derivatives exchange. The combined company, to be named CME Group Inc., a CME/Chicago Board of Trade Company, is expected to transform global derivatives markets, creating operational and cost efficiencies for customers and exchange members, while delivering significant benefits to shareholders. Corporate headquarters of the combined organization will remain in Chicago.-source
Friday, May 26, 2006
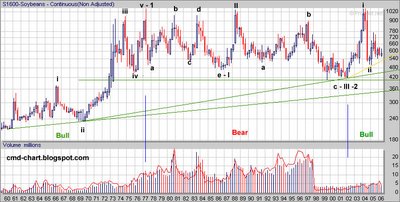
Soybeans Futures (S) Elliott Wave Count Analysis
Soybeans Futures contracts and soybeans Options on futures contracts are trading at the Chicago Board of Trade (CBOT). Contract Size = 5,000 bushels. Like Oats Futures (O) I notice steep Volume decline since the nineties. - If anyone can contribute more info regarding Soy beans please add comment or send email
You can click on the chart to enlarge:
You can click on the chart to enlarge:

Tuesday, May 23, 2006
Oats Futures (O) CBOT
Oats Futures contracts and Options on Futures are trading at the Chicago Board of Trade (CBOT). Contract size is 5,000 bushels No. 2 Heavy and No. 1 at par. For more details See CBOT.
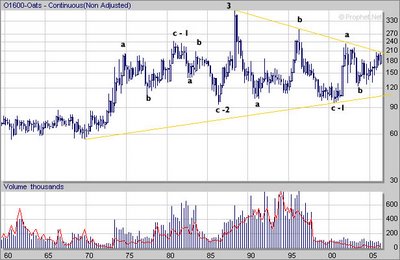
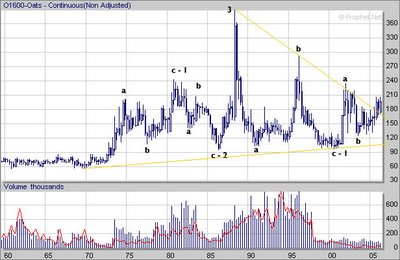
Technically, Oats futures contracts are currently trading at the same nominal price like 1975 !
The Elliott wave count is quite odd, however that the best I could do, If you have another wave count please send it to me. If you need a basic Elliott Wave tutorial see EWI (might need registration)
If you look at the logarithmic chart the triangle pattern is not yet broken to the upside. Whereas On the linear oats futures chart the triangle is already broken to the upside.


Sunday, May 21, 2006
Rough Rice Futures
Rough Rice Futures and Options on Futures are trading at the Chicago Board of Trade (CBOT). Contract size is 2,000 hundredweight (cwt.) of U.S. No. 2 or better long grain rough rice. For more details See CBOT


Thursday, April 13, 2006
Corn Futures (C) , (YC)
Corn (Maize) is widely cultivated throughout the world and a greater weight of corn is produced each year than any other grain. While the United States produces almost half of the world's harvest, other top producing countries are: China, Brazil, France, Indonesia, and South Africa. Worldwide production was over 600 million metric tons in 2003 just slightly more than rice or wheat. In 2004, close to 33 million hectares of maize were planted worldwide, with a production value of more than $23 billion.
The primary use for corn is as a food or feed for livestock, Corn also has many industrial uses. Some is hydrolyzed and treated to produce corn syrup, a sweetener, and some is fermented and distilled to produce grain alcohol, or ethanol. Grain alcohol from corn is traditionally the source of bourbon whiskey. Ethanol is being used as an additive in gasoline (gasohol) for motor fuels to increase the octane rating, lower pollutants, and reduce petroleum use.
The corn futures are traded at the Chicago Board of Trade (CBOT)
Contract Size is 5000 bushels for the regular future contract and 1000 bushels for the mini future contract, corn options are also available.
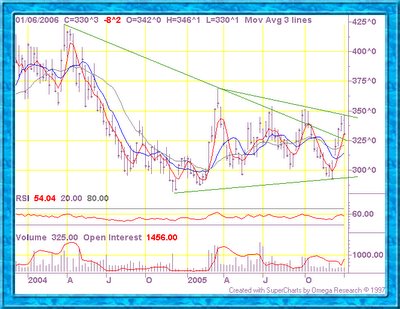
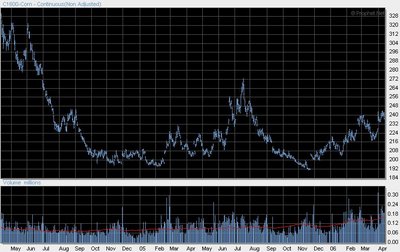
Corn seems to put in a nice double bottom pattern:
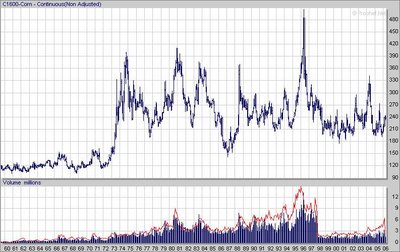
50 years chart of corn Futures
The primary use for corn is as a food or feed for livestock, Corn also has many industrial uses. Some is hydrolyzed and treated to produce corn syrup, a sweetener, and some is fermented and distilled to produce grain alcohol, or ethanol. Grain alcohol from corn is traditionally the source of bourbon whiskey. Ethanol is being used as an additive in gasoline (gasohol) for motor fuels to increase the octane rating, lower pollutants, and reduce petroleum use.
The corn futures are traded at the Chicago Board of Trade (CBOT)
Contract Size is 5000 bushels for the regular future contract and 1000 bushels for the mini future contract, corn options are also available.
Corn seems to put in a nice double bottom pattern:

50 years chart of corn Futures

Monday, January 09, 2006
Subscribe to:
Posts (Atom)

