Commodities Charts Homp Page
Showing posts with label CCI. Show all posts

Sunday, March 30, 2008

Commodities long term Top ?

In recent years most commodities had a huge run up. The Reuters CRB Continuous Commodity Index climbed more then 200%. By definition as a bull market is maturing there is less and less upward potential. I am sure there are many good reasons for commodities prices to be where they are and the outlook might seems even better but that is usually the case at cyclical top of any bull market.

Bull markets often end in a spectacular rally one in which big profits are made quickly. Have we just seen that?, Is the commodities long term top is in place ?

That's is not my point but the odds for multi month/year correction are certainly increasing.


The CCI index had surely proved itself to be the one index to follow this asset class.

CCI chart

CRB chart

Wednesday, June 20, 2007

CCI Commodities Index

As previously explained, the CCI is the best barometer available for tracking the condition of the general commodities market. The CCI just made a new bull market high. If you are going to trade this index or any of its components be sure to study each of them both fundamentally and technically!

Long term trend support around the 50 weeks moving average.


cci chart

Short term trend line support around 402.

cci chart

Monday, April 09, 2007

The CCI Index

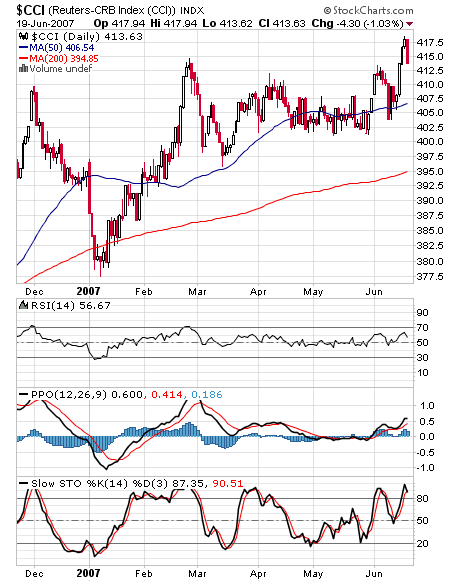
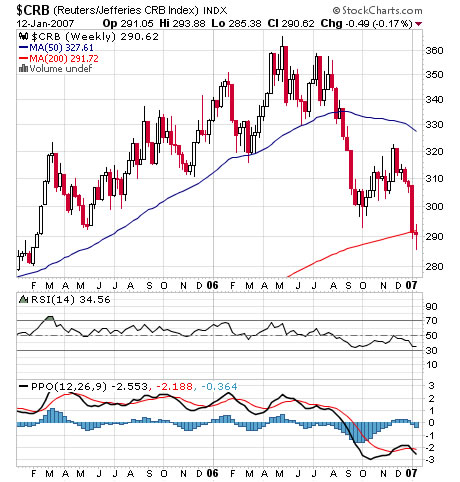
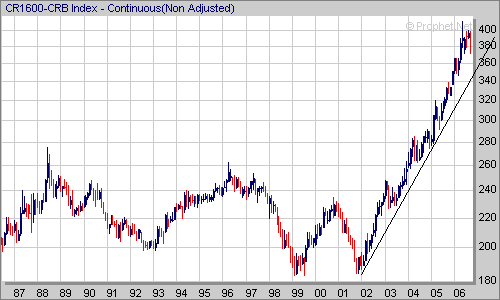
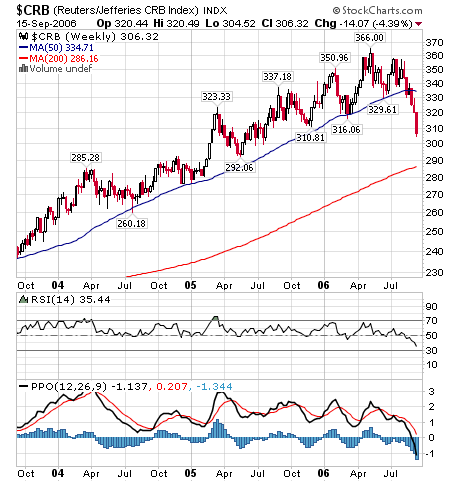
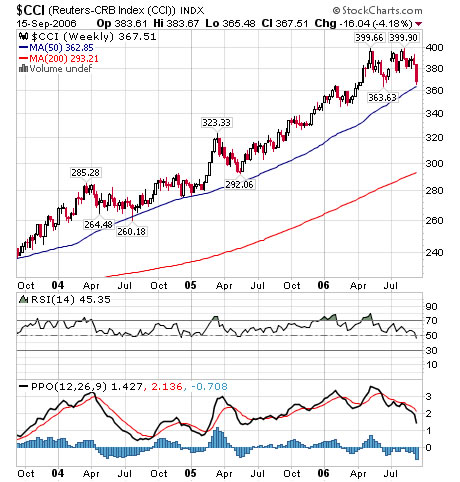
For all practical purposes the Continuous Commodity Index (CCI) is the preferred index for tracking the condition of the general commodities market. The reason for that is the way in which this index is calculated – The CCI Methodology.

5.88% for each of the 17 individual commodities included(Energy 17.64% : WTI Crude Oil, Heating Oil, Natural Gas, Grains 17.64% : Corn, Wheat, Soybeans, Livestock 11.76% :
Live Cattle, Lean Hogs, Softs 29.40% : Sugar, Cotton, Coffee, Cocoa, Orange Juice, Metals 23.52% : Gold, Silver, Platinum, Copper)


Here is the explanation of the CCI Methodology from the NYBOT:


The Continuous Commodity Index (CI)is weighted evenly among 17 component commodities. Each weighting is used for both arithmetic averaging of individual commodity months and for geometric averaging of the 17 commodity averages. With equal weighting, no single contract month or commodity has undue impact on the Index. The CCI uses a system of averaging all futures prices six months forward, up to a maximum of five delivery months per commodity. A minimum of two delivery months, however, must be used to calculate the current price if the second contract is outside the six-month window. Contracts in the delivery period are excluded from the calculation. Although each of the 17commodities is equally weighted, the CCI uses an average of the prices of the 17 commodities and an average of those commodities across time within each commodity. Each commodity is arithmetically averaged across time (the six-month window) and then these 17 component figures are geometrically averaged together. The continuous rebalancing provided by this methodology means the Index constantly decreases exposure to commodity markets gaining in value and increases exposure to those markets declining in value.

Saturday, March 17, 2007

Buy & Hold Commodities?

The DBC commodity ETF was listed on the AMEX at early February 2006, interestingly after a little more then a year the thing has gone nowhere!

Anyone who bought the DBC at the IPO has seen little to no returns while at the same time nimble traders had several long & short trading opportunities.

At the same time (February 2006 – March 2007) the CCI which is a broader commodity index have gained around 10%.

That’s made me thinking - Did Deutsche bank picked the wrong commodities?

Technically:

The DBC is near the 50 / 200 Moving averages and the 50% Fibonacci level. RSI is trending down below 50. The PPO is negative but still above the zero line.

dbc chart

CCI(NYBOT) long term chart

cci long term chart

Monday, January 15, 2007

Commodity Indices CRB vs. CCI Part 2

At September 2006 I have posted about an interesting divergence between the CRB and CCI commodity indices. The divergence has extended much farther and the CCI methodology have proved to be better (see the CCI & CRB weekly charts below), at least from for capital appreciation point of view. It appears that crude oil and crude oil derivatives commodities are weighted heavily in the CRB and other propriety indices.

Going forward commodities investors should be cautious as some commodities are at a point they can easily decline by up to 50%. It is my opinion that the commodities markets will be more difficult this year with increased divergence (between different commodities) and higher volatility.


CCI Index chart


CRB Index chart

Saturday, September 16, 2006

CRB, CCI COMMODITY INDEX

CRB/ CCI are under serious correction since around when the US FED paused the IR hikes. The FED policy seems be pretty successful – price stabilization while equity markets did not suffer much pain.

There is an interesting divergence between the CRB and CCI. Long term monthly CCI chart still look pretty good, short term the CRB has been sliding much lower then CCI.

More Info regarding CRB indexes could be found at CRBTrader.com and The New York Board of Trade NYBOT.

cci long term chart

crb weekly chart

cci weekly chart

Search

Labels