Commodities Charts Homp Page
Showing posts with label Elliott Wave. Show all posts

Wednesday, March 07, 2007

Aluminum Chart (COMEX: AL)

Between the second quarter of 2005 and the Second quarter of 2006 the price of aluminum climbed about 66 cents per pound (0.79$ - 1.45$) for an 83% nominal gain. Note that the price took shape of five wave pattern. According to Elliott waves analysis once a five wave pattern is completed a three wave counter trend should be expected (A, B, C). I estimate that wave (c) is currently underway and a lower low then (a) should follow. The RSI indicator is trending down below 50 and PPO is slightly negative.

Aluminum chart (AL)

Saturday, August 05, 2006

Coffee Futures (NYBOT : C) - Elliott Wave Count

Coffee futures and options are trading at the New York Board of Trade (NYBOT). Coffee is one of the components of the CRB INDEX.

The price is quoted at cents per pound; contract size is 37,500 pounds for the full size contract (CK) and 12,500 pounds for the mini size contract (MK).

From the long term chart below we can learn that since the first half of 1977 till the second half of 2001 coffee was in a severe bear market and lost about 85% of its price.

 Coffee Futures chart

Since 2001 Coffee (like so many other commodities)is going up consistently with occasional pullbacks. I think that the 2001 bottom in the price of coffee is significant and technically coffee is positioned for a long bull market.

Short term coffee consolidates and forming a symmetrical triangle pattern, a break out one way or another should soon follow. If coffee can break above the (b) high that will indicate that the short term correction is over while a break down below the (a) low will indicate that some more consolidation is required before the continuation of the long term bull market.

Coffee Futures chart

Sunday, July 09, 2006

Palladium Futures (NYMEX: PL) Chart Analysis

Palladium had a spectacular rally, up 140% percent in little less then a year!
Topping out at 410$, it then pulled back roughly 61.8% of the rally to touch its 50 weeks moving average (WMA)and bottomed at 267$. Palladium lost 35% in one month!

Palladium weekly chart

The Elliott wave is unclear to me but the most likely scenario: wave three still in progress, this way or that way I think that higher highs will follow. The price of palladium is currently above the 38.2% Fibonacci line and this level should provide some support along the green uptrend line and the 50 WMA. Notice that the 200 WMA is stable and seems to turn back up. RSI turned back up above 50, PPO bearish crossover but still above zero, PPO histogram negative, ADX slightly bearish.

Palladium weekly chart


Palladium daily chart

The price of palladium broke up above the pink downtrend line and is currently above the 38.2% Fib and its 200 DMA. RSI trends up above 50, PPO bullish crossover but still below zero, PPO histogram positive, ADX improving. Support at the 38.2% Fib and the 200 DMA, the pink line probably get tested. Resistance at the Fibs above the current price, the 50 DMA and the high (410$).


Palladium daily chart


Related:

Palladium long term Elliott wave count

Gold and Silver charts analysis

Saturday, May 27, 2006

Crude Oil Futures WTI Elliott Wave Analysis

Crude is trading in a rising channel for more then four years.
The Oil WTI wave is complex, Impulsive and Hyper Extensive, Bull wave that can easily extend even further and continue for several years without serious correction. I will not be in a hurry to call the top for crude oil as the chart is nowhere near to suggest that. Crude Oil is an important corner stone in this great global commodity bull market. Some clumsy reporters like to mistakenly call it the black gold – it is an oxymoron!

So.. Looking at the weekly chart it easy to see that the pullbacks have been modest since the bull cycle started late 2001. The channel is intact and the price has room to move in both directions. On the daily chart again partial wave count with the next move likely to be wave 3 up to new all time high , I would like to remind the number 81$ as an initial target , partial profit taking suggestion.

Click charts to enlarge:


Crude Oil Futures WTI daily chart

Crude Oil Futures WTI weekly chart

Friday, May 26, 2006

Soybeans Futures (S) Elliott Wave Count Analysis

Soybeans Futures contracts and soybeans Options on futures contracts are trading at the Chicago Board of Trade (CBOT). Contract Size = 5,000 bushels. Like Oats Futures (O) I notice steep Volume decline since the nineties. - If anyone can contribute more info regarding Soy beans please add comment or send email

You can click on the chart to enlarge:

Soybeans Futures (S) Long term chart

Tuesday, May 23, 2006

Oats Futures (O) CBOT

Oats Futures contracts and Options on Futures are trading at the Chicago Board of Trade (CBOT). Contract size is 5,000 bushels No. 2 Heavy and No. 1 at par. For more details See CBOT.

Technically, Oats futures contracts are currently trading at the same nominal price like 1975 !

The Elliott wave count is quite odd, however that the best I could do, If you have another wave count please send it to me. If you need a basic Elliott Wave tutorial see EWI (might need registration)

If you look at the logarithmic chart the triangle pattern is not yet broken to the upside. Whereas On the linear oats futures chart the triangle is already broken to the upside.

Oats Futures Long term logarithmic Chart

Oats Futures Long term linear Chart

Sunday, May 21, 2006

Rough Rice Futures

Rough Rice Futures and Options on Futures are trading at the Chicago Board of Trade (CBOT). Contract size is 2,000 hundredweight (cwt.) of U.S. No. 2 or better long grain rough rice. For more details See CBOT


Rough Rice Futures chart

Friday, May 19, 2006

Crude OIL WTI Elliott wave count ; USO AMEX ETF

Crude Oil - one of the most important commodities if not the most important. Since the USO ETF(United States Oil Fund Lp)IPO Investors or stock traders can get direct exposure to the price of WTI crude oil.

Crude OIL WTI Elliott wave count chart

USO ETF(United States Oil Fund Lp)chart

Saturday, May 06, 2006

Frozen Pork Bellies Futures (CME: PB) Elliott Wave count

Frozen Pork Bellies Futures and Options on Futures are trading at the Chicago Mercantile Exchange(CME).

Contract Size = 40,000 pounds of frozen pork bellies, cut and trimmed.

Frozen Pork Bellies Futures (CME: PB) Elliott Wave count long term price chart


Frozen Pork Bellies Futures long term log chart

Monday, May 01, 2006

Palladium Futures (PA, NYMEX) Charts & Waves

Here are three charts of palladium annotated with Elliott wave counts, the first chart is a weekly log chart. The other two are long term (30 years) quarterly palladium futures charts, log and linear. If you are new to Elliot wave read this Free Elliot wave tutorial, if you want to know more about Elliot wave I recommend that you read this book and try the EWI subscription (30 days Free trail)

Click on the charts below to enlarge:
Palladium Futures (PA, NYMEX) chart

Palladium Futures (PA, NYMEX) long term log chart

Palladium Futures (PA, NYMEX) long term linear chart

Thursday, April 27, 2006

Platinum Futures (NYMEX: PL) , Chart

Platinum is trading above the 1980 high. The daily platinum futures chart is looking good with many white candles, short term trend line support ~ 1105$. Platinum Info.


Platinum Futures (NYMEX: PL) , Chart

Platinum Futures (NYMEX: PL) , long term Chart

Platinum Futures (NYMEX: PL) , long term Chart

Gold & Silver spot charts

Saturday, April 22, 2006

Orange Juice Futures (NYBOT: OJ) E – Waves count

Frozen Concentrated Orange Juice (FCOJ) futures and options on futures contracts are trading at The New York Board of Trade (NYBOT). OJ futures trading introduced in 1966, with options trading since 1985. The NYBOT FCOJ futures and options market traditionally provide critical weather risk management tools to this highly dependent commodity weather market, especially sensitive to weather conditions in Florida and Brazil.
Contract size 15,000 pounds of orange solids ( 3% more or less ) from Florida and or Brazil only.


Orange Juice futures (OJ) quarterly all time chart.

Orange Juice futures (OJ) long term chart chart


Orange Juice futures (OJ) bottom to date weekly chart.

Orange Juice futures (OJ) chart


Seems like fairly young bull market.

Tuesday, April 11, 2006

Crude Oil Futures , CL (Chart update)


The price of crude is struggling with the upper diagonal downtrend line, RSI & MACD are rising. If a breakout is indeed successful the triangle target is ~ 81$


Crude Oil Futures , CL (Chart update)

Wednesday, March 29, 2006

Crude Oil chart ( NYMEX : CL )

Still trading below Aug 2005 all time high, possibly constructing a symmetrical triangle pattern , RSI , MACD are trending up on the daily chart.


Crude Oil chart ( NYMEX : CL )

Previous review of Crude Oil

Gold and Silver charts, news, reviews & commentary

Friday, March 03, 2006

Crude oil NYMEX chart

Click on the chart below to enlarge:

Crude oil NYMEX chart

Thursday, February 16, 2006

Palladium Futures

Palladium is a chemical element with symbol Pd and atomic number 46. A rare silver-white transition metal of the platinum group, palladium resembles platinum chemically and is extracted from some copper and nickel ores.

Palladium is the other major metal of the platinum group. It is mined with platinum, and resembles it in many respects, yet there are important differences between the two metals. Palladium is also produced as a by-product of nickel mining. Russia supplies about 67% of production, South Africa, 23%; and North America, 8%. Annual production runs approximately 8.1 million ounces.

Automotive catalysts are the largest consuming sector, accounting for 63% of demand. Electronic equipment accounts for 21%; dental alloys, 12%; and jewelry, 4%.

Trading Unit: 100 troy ounces.


Palladium Futures price(PA, NYMEX) long term log chart

Palladium Futures price (PA, NYMEX) long term linear chart

Platinum Futures

Platinum is a chemical element in the periodic table that has the symbol Pt and atomic number 78. A heavy, malleable, ductile, precious, grey-white transition metal, platinum is resistant to corrosion and occurs in some nickel and copper ores along with some native deposits.

Platinum is the principal metal of the six-metal group that bears its name; the other platinum group metals are palladium, rhodium, ruthenium, osmium, and iridium. All possess unique chemical and physical qualities that make them vital industrial materials.

Jewelry creates the largest demand for platinum, accounting for 51%. Automotive catalysts take 29% and chemical and petroleum refining catalysts, 13%.

Platinum is used in the computer industry and in other high-tech electronic applications since it is an excellent conductor of electricity, does not corrode, and has a low reactivity with other metals. This sector accounts for about 7% of consumption.

Platinum is among the world's scarcest metals; new mine production totals approximately only 5 million troy ounces a year. In contrast, gold mine production runs approximately 82 million ounces a year, and silver production is approximately 547 million ounces.

Supplies of platinum are concentrated in South Africa, which accounts for approximately 80% of supply; Russia, 11%; and North America, 6%.

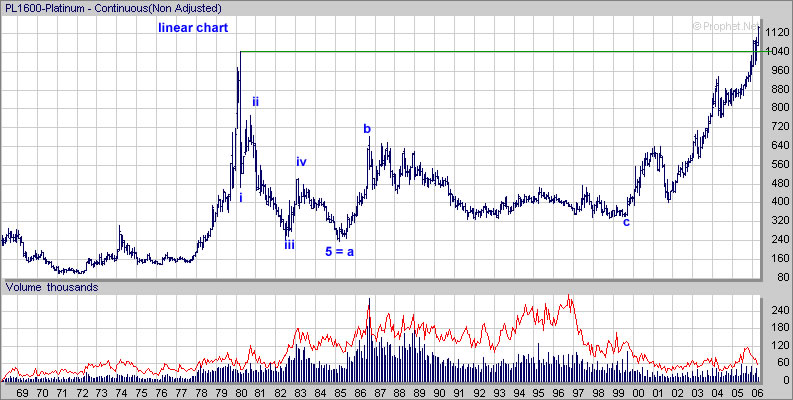
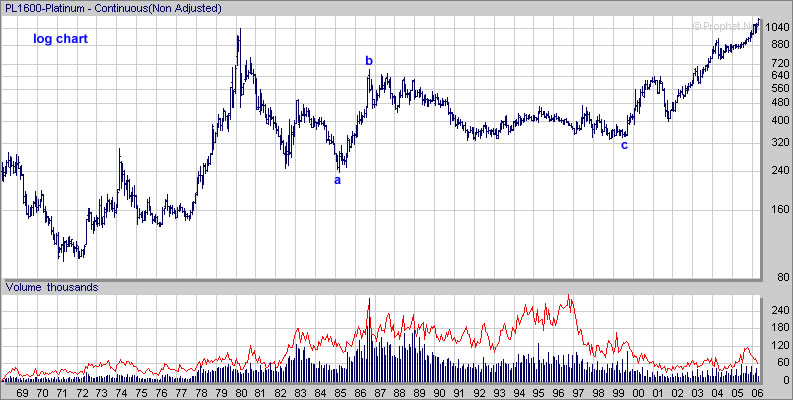
Because of the metal's importance as an industrial material, its relatively low production, and concentration among a few suppliers, prices can be volatile. For this reason, it is often considered attractive to investors.

Trading Unit 50 troy ounces.

Platinum Futures price (NYMEX: PL) , long term Chart

Platinum Futures (NYMEX: PL) , long term price Chart

Gold & Silver spot charts

Thursday, February 09, 2006

Search

Labels