Commodities Charts Homp Page
Showing posts with label Palladium. Show all posts

Tuesday, January 08, 2008

Palladium

Not all commodities are at new all time highs.

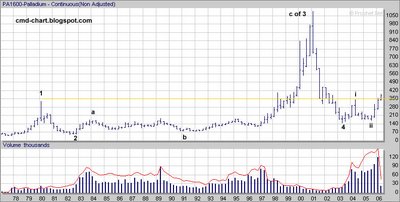
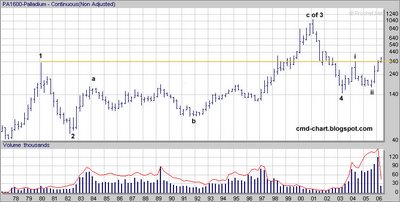
Palladium for example is about 60% below its 2001 highs. This volatile metal was trading anywhere between ~1100$ and less then 100$ over the last 30 years.

There are several ways to invest, trade and speculate in palladium:

1) Physical palladium: Palladium ETF (LSE: PHPD) and palladium maple coins.

2) Palladium derivatives: Futures (Nymex: PA)

3) Palladium mining stocks: SWC, PAL.


Monday, April 23, 2007

LSE Precious Metals ETFs

In addition to the new SWISS Precious Metals ETF's, Five new physical precious metals ETF's are issued on the London Stock Exchange:


Physical Platinum, LSE code: PHPT
Physical Palladium, LSE code: PHPD
Physical Silver, LSE code: PHAG
Physical Gold, LSE code: PHAU
Physical PM Basket, LSE code: PHPM


source

Monday, April 16, 2007

Platinum, Palladium & Silver ETFs

Last November it was a bad idea now it’s a good one?


Zuercher Kantonalbank, the biggest of Switzerland's 24 government-controlled cantonal lenders, will launch exchange-traded funds (ETFs) for three precious metals, including platinum, after it launched a gold ETF early last year.

The bank plans to list the new ETFs, based on silver, platinum and palladium, on the SWX Swiss Exchange and trading is scheduled to start on May 10, the bank said in a press release on April 13. The new investment products are designed for wealthy private clients and institutional investors, it said. -source


Price wise it seems like none event for now...

Platinum Spot


Palladium Spot

Sunday, July 09, 2006

Palladium Futures (NYMEX: PL) Chart Analysis

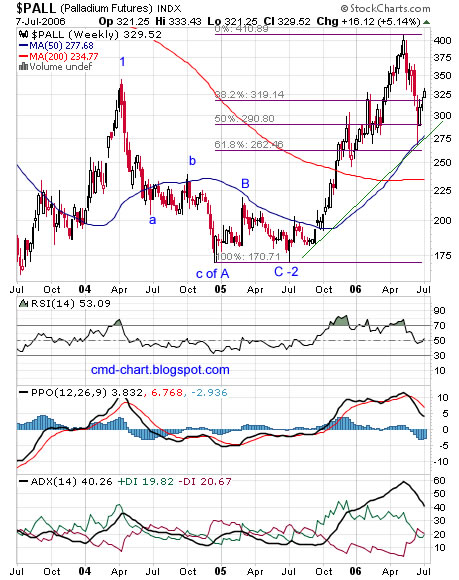
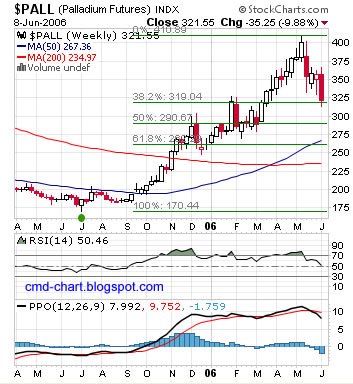
Palladium had a spectacular rally, up 140% percent in little less then a year!
Topping out at 410$, it then pulled back roughly 61.8% of the rally to touch its 50 weeks moving average (WMA)and bottomed at 267$. Palladium lost 35% in one month!

Palladium weekly chart

The Elliott wave is unclear to me but the most likely scenario: wave three still in progress, this way or that way I think that higher highs will follow. The price of palladium is currently above the 38.2% Fibonacci line and this level should provide some support along the green uptrend line and the 50 WMA. Notice that the 200 WMA is stable and seems to turn back up. RSI turned back up above 50, PPO bearish crossover but still above zero, PPO histogram negative, ADX slightly bearish.

Palladium weekly chart


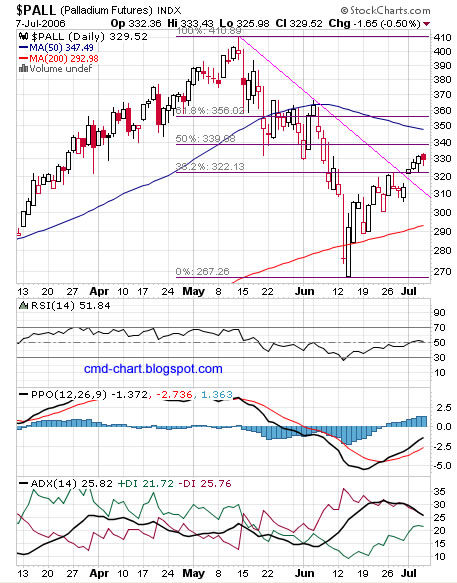
Palladium daily chart

The price of palladium broke up above the pink downtrend line and is currently above the 38.2% Fib and its 200 DMA. RSI trends up above 50, PPO bullish crossover but still below zero, PPO histogram positive, ADX improving. Support at the 38.2% Fib and the 200 DMA, the pink line probably get tested. Resistance at the Fibs above the current price, the 50 DMA and the high (410$).


Palladium daily chart


Related:

Palladium long term Elliott wave count

Gold and Silver charts analysis

Friday, June 09, 2006

Platinum & Palladium Futures

Platinum (PL) and Palladium (PA) futures contracts and options on futures contracts are trading at the New York Mercantile Exchange (NYMEX.)

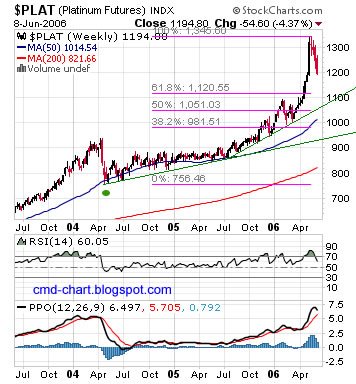
Like Gold and Silver, Platinum and Palladium are at an ongoing correction, Palladium has lost around 38% of the last up leg, platinum have held better. Platinum recent up leg was longer then the up leg in the price of palladium or gold, Palladium is usually more volatile then Platinum.

Platinum futures (PL) chart

Palladium futures (PA) chart

Tuesday, May 16, 2006

Platinum, Palladium, Rhodium, Ruthenium & Iridium Supply Demand Analysis Report

Johnson Matthey precious metals division has published a detailed report regarding the Platinum group metals (PGM). The report includes detailed supply demand analysis for: Platinum, Palladium, Rhodium, Ruthenium & Iridium - link

Monday, May 01, 2006

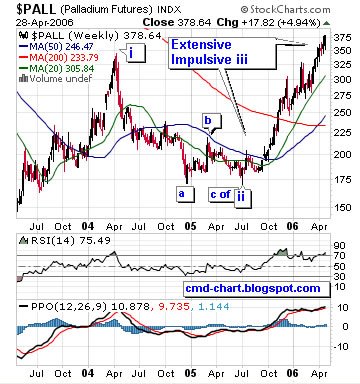
Palladium Futures (PA, NYMEX) Charts & Waves

Here are three charts of palladium annotated with Elliott wave counts, the first chart is a weekly log chart. The other two are long term (30 years) quarterly palladium futures charts, log and linear. If you are new to Elliot wave read this Free Elliot wave tutorial, if you want to know more about Elliot wave I recommend that you read this book and try the EWI subscription (30 days Free trail)

Click on the charts below to enlarge:
Palladium Futures (PA, NYMEX) chart

Palladium Futures (PA, NYMEX) long term log chart

Palladium Futures (PA, NYMEX) long term linear chart

Thursday, March 16, 2006

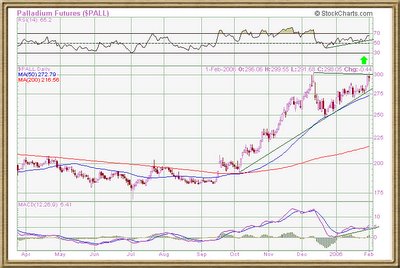
Palladium Futures , NYMEX : PA

Technically it's a breakout and higher high will probably follow.

Palladium Futures chart, NYMEX : PA

Thursday, February 16, 2006

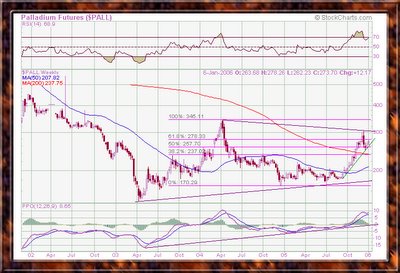
Palladium Futures

Palladium is a chemical element with symbol Pd and atomic number 46. A rare silver-white transition metal of the platinum group, palladium resembles platinum chemically and is extracted from some copper and nickel ores.

Palladium is the other major metal of the platinum group. It is mined with platinum, and resembles it in many respects, yet there are important differences between the two metals. Palladium is also produced as a by-product of nickel mining. Russia supplies about 67% of production, South Africa, 23%; and North America, 8%. Annual production runs approximately 8.1 million ounces.

Automotive catalysts are the largest consuming sector, accounting for 63% of demand. Electronic equipment accounts for 21%; dental alloys, 12%; and jewelry, 4%.

Trading Unit: 100 troy ounces.


Palladium Futures price(PA, NYMEX) long term log chart

Palladium Futures price (PA, NYMEX) long term linear chart

Sunday, January 08, 2006

Search

Labels