Commodities Charts Homp Page
Showing posts with label Copper. Show all posts

Friday, July 06, 2007

Copper Inventories

As you probably know low stocks equals less supply and thus the price of copper is normally inversely correlated with LME copper warehouse stocks. The LME copper warehouse stocks level are declining consistently since February 2007, already down 50%. Copper stocks are down from about 200,000 to. 105,475 tonne (July 6).


Technically the copper chart looks fine , a-b-c 3 waves correction then an impulsive rally (wave i) , wave iii is currently underway, PPO , RSI up trending bullish. Potential inverted head shoulders pattern with a price objective of 520.


copper chart

Tuesday, February 13, 2007

Copper Charts

Copper is one of the most important tradable base metals. The price of copper topped at the second quarter of 2006 after going extremely parabolic and registering an all time high. I have warned about that extreme situation at least two times.

See:

Copper Futures , Comex : HG & Wednesday, May 31, 2006
Copper HG COMEX Futures


One of the most important indicators for the price of copper is the LME stocks levels which seems to bottom and are up more then 100% since mid 2006.

Currently Copper is oversold and I would like to suggest 220 and 190 as important price levels, on the 50 years chart the 145 seems to be the most important price level.


Copper weekly chart


long term copper chart

LME copper stocks

Thursday, July 20, 2006

Dow Jones-AIG Industrial Metals Index

Dow Jones-AIG Industrial Metals Index includes: Aluminum, Copper, Zinc and Nickel.

The Indexed topped at mid 2006 ( top labeled 1) and lost 60 points or about 23% by mid June a bottom (labeled 2) was made and the index climbed higher to recoup most of decline.

Currently the index is trading just below the 50 daily moving average (DMA), RSI trending down, PPO still positive but seems to be ready to turn back down. Short term support at 230 - where the green and pink lines cross each other. Failure to hold the 230 level will indicate that the correction is not over and lower low (lower then 2) will follow. A successful retest of the 230 level will indicate the correction is over and higher highs should be expected.

Dow Jones-AIG Industrial Metals Index chatr

Monday, July 03, 2006

Copper Futures (HG) technical analysis

Copper Daily Chart

Short term bottom established at around 2.91$ per pound of copper, this price level is between the 61.8% and the 50% Fibonacci levels of the February – May 2006 wave up. The price of copper traded and closed above the diagonal downtrend resistance line (orange). Copper is currently trading above the 38.2% Fibonacci level of the May – June wave down. A new trend line (green) is visible - connecting the March and June bottoms. RSI trending up above 50, PPO on the verge of crossing over, PPO histogram slightly positive and the slow stochastic trending up above 50.

Short term support at the Fibonacci levels below the current price and at the green uptrend line. Short term resistance at the 50 DMA, the Fibonacci lines above current price and the pink downtrend line coming from May top, which is the all time high for copper.

Copper Daily Chart


Copper Weekly Chart

The price of copper pulled back to the 38.2% Fibonacci level area of the monster up wave which started at Q2-2004. Short term bottom seems to be in place. RSI still above 50 and turning back up, PPO crossover - bearish, PPO histogram negative and stochastic trending down but still above 50 and might turn up soon.

Support on the intermediate term chart is at the Fibonacci support lines the 50 WMA (blue) and the green uptrend lines.Resistance at all time high : ~4.00$ per pound of copper.

Copper Weekly Chart

Monday, June 05, 2006

Does keeping the penny still make sense?

It's all about the price of Zinc and Copper

By J. Scott Orr

Newhouse News Service

WASHINGTON — They accumulate everywhere, multiplying faster than bunnies, it seems, in pockets, purses and dresser-top jars. And you can't buy much with them.

So why doesn't the United States get rid of the penny, especially now, when, for the first time, the copper-coated coins cost the government more than 1 cent each to make?

At least one bill has been introduced in Congress to retire the coin, but it never gained traction. And the bottom line may be that when it comes to the penny, Americans don't want change.

"Americans want to keep the penny, it's that simple," said Matthew Eggers, policy director of Americans for Common Cents, which is fighting to keep the coin in circulation.

The most recent survey — conducted last year by Coinstar, a Bellevue company that puts coin-counting machines in supermarkets and other locations — found 66 percent of Americans want to keep the penny. It also found 79 percent will stop to pick up a penny.

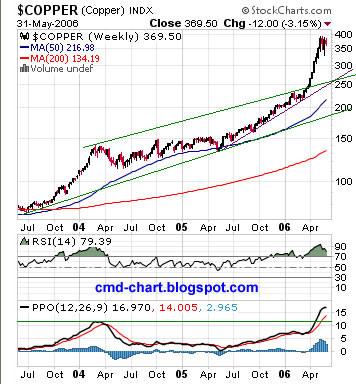
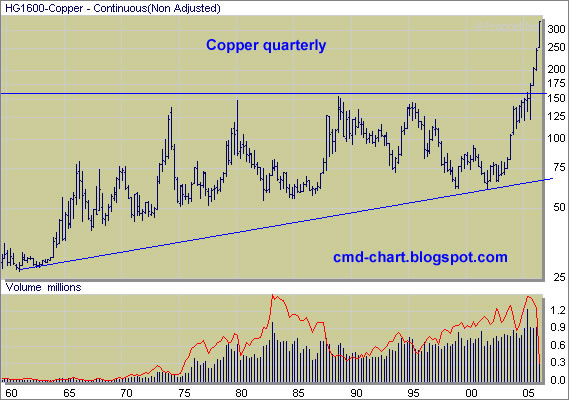
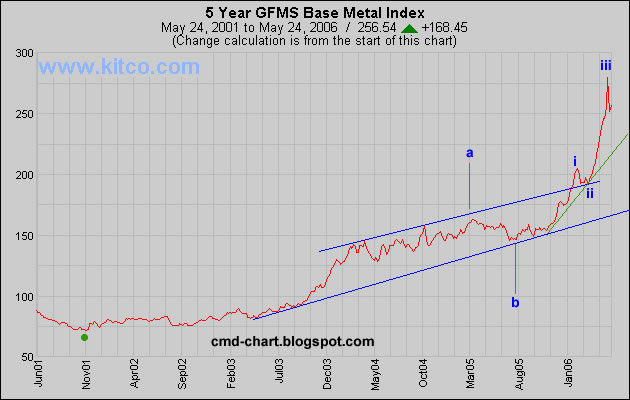
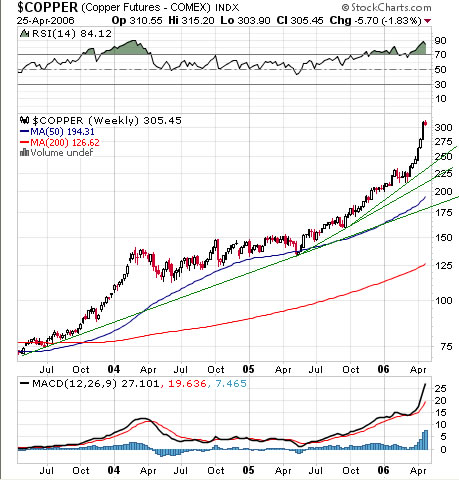
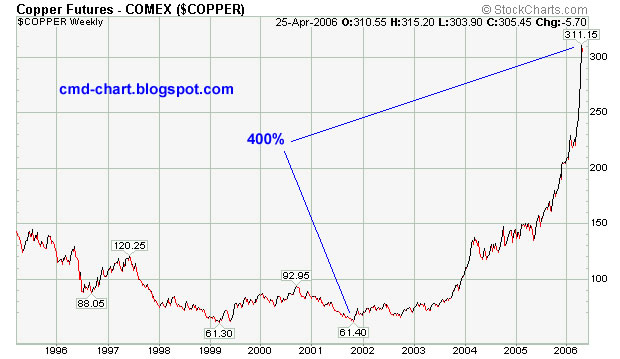
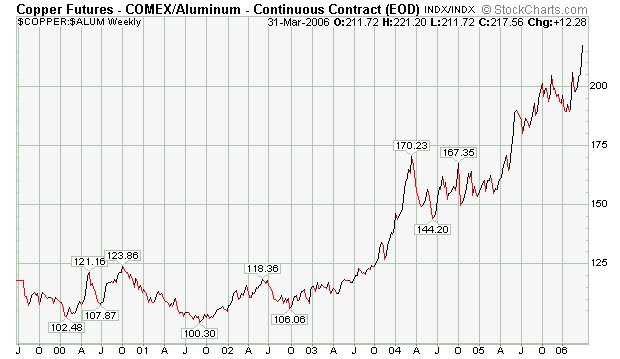
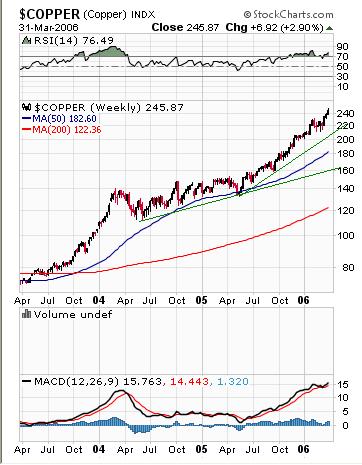
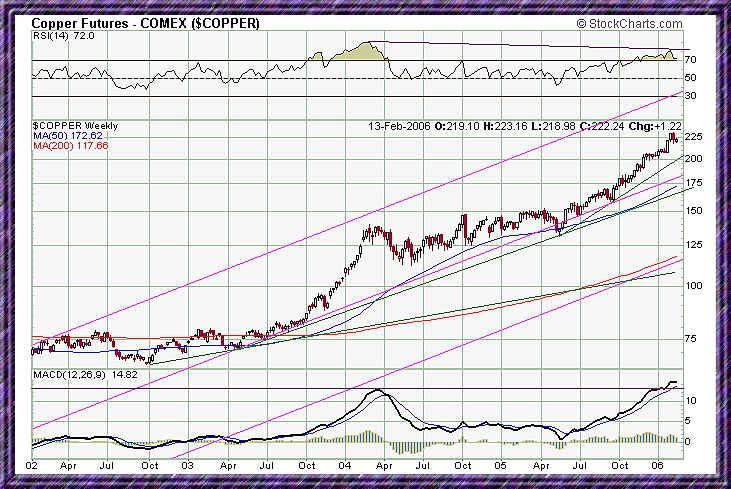
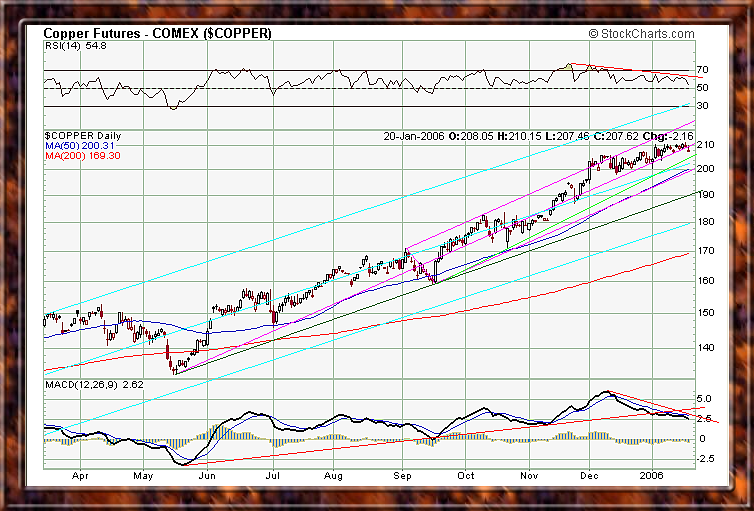
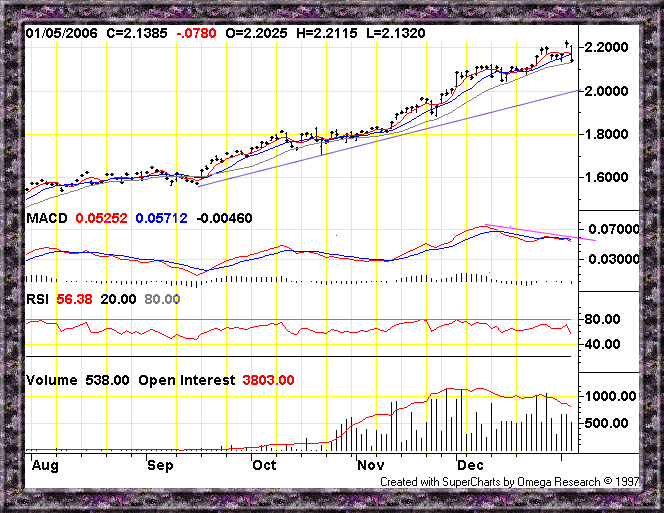
But the penny's detractors have been buoyed by new figures from the U.S. Mint that show the skyrocketing prices of the two metals used to make the penny — zinc and copper — have pushed the cost of making the coin across the 1-cent threshold for the first time, to 1.23 cents. The penny is 97.5 percent zinc and 2.5 percent copper, according to the mint... -source

Wednesday, May 31, 2006

Copper HG COMEX Futures

Copper is extremely parabolic. I'm sure there are excellent fundamentals for the extraordinary spike in the price of copper but technically it is extreme. On the daily chart both RSI and PPO are trending down but the price haven't pulled back much. Copper is forming some kind of triangle pattern and pattern resolution should soon follow. The weekly charts tells a different story , RSI and PPO looks pretty good and the pattern still looks reasonably bullish. Copper haven't necessarily seen its top yet.

Copper Hg comex Futures daily chart

Copper Hg comex weekly chart

Copper Futures , Comex : HG long term chart


Browse this blog archive

See Gold, Silver, Metals mining stocks

Thursday, May 25, 2006

GFMS Base Metal Index Waves Analysis

GFMS base metal index is based on the official London Metal Exchange - LME - cash settlement price for primary aluminium, copper, lead, nickel, tin and zinc. The index is an average of the six prices with equal weighting given to each of the six metals. The index is based on January 4th 2000 = 100.


Click on the chart below to enlarge
GFMS Base Metal Index Chart

Wednesday, April 26, 2006

Copper Futures , Comex : HG

Copper futures and spot have really gone extremely parabolic, registering ~ 400% price appreciation since the bear market bottom. Amazing!


Copper Futures , Comex : HG


Copper warehouse stocks


Copper Futures , Comex : HG long term chart


Gold and Silver Charts

Wednesday, April 19, 2006

NYMEX to change margins for silver, copper futures contracts

Washington (Platts)--18Apr2006

The New York Mercantile Exchange on Tuesday announced margin changes for
its silver and copper futures contracts, beginning at the close of business on
Wednesday.

Margins for the silver futures contract will increase to $3,750 from
$3,250 for clearing and non-clearing members and to $5,063 from $4,388 for
customers. Margins for the copper futures contract will increase to $3,750
from $3,500 for clearing and non-clearing members and to $5,063 from $4,725
for customers. source

Sunday, April 02, 2006

Copper High Grade (HG, Comex) & Aluminum (AL, COMEX)

Aluminum is a partial substitute for copper; currently copper is more then two times more expensive then the same weight of aluminum. Aluminum is also a component of the Deutsche-bank commodities index DBLCI which is tracked by the DBC ETF.


copper aluminum ratio chart
Copper High Grade (HG, Comex) chart
Aluminum (AL, COMEX) chart

Thursday, February 16, 2006

Copper Futures (Comex : HG )

Copper is a chemical element in the periodic table that has the symbol Cu and atomic number 29. Copper, one of the oldest commodities known to man, is a product with fortunes which directly reflect the state of the world economy. It is the world's third most widely used metal, after iron and aluminum, and is primarily used in highly cyclical industries such as construction and industrial machinery manufacturing. Profitable extraction of the metal depends on cost-efficient high-volume mining techniques, and supply is sensitive to the political situation particularly in those countries where copper mining is a government-controlled enterprise.

Copper was first worked about 7,000 years ago. Its softness, color, and presence in nature enabled it to be easily mined and fashioned into primitive utensils, tools, and weapons. Five thousand years ago, man learned to alloy copper with tin, producing bronze and giving rise to a new age.

Trading Unit 25,000 pounds

Copper Futures , Comex : HG long term price chart


Gold and Silver Charts

Tuesday, February 14, 2006

Copper Futures Chart - COMEX

Click on the chart below to enlarge:

Monday, January 23, 2006

Thursday, January 05, 2006

Search

Labels