As previously
explained, the CCI is the best barometer available for tracking the condition of the general commodities market. The CCI just made a new bull market high. If you are going to trade this index or any of its components be sure to study each of them both fundamentally and technically!
Long term trend support around the 50 weeks moving average. Short term trend line support around 402.
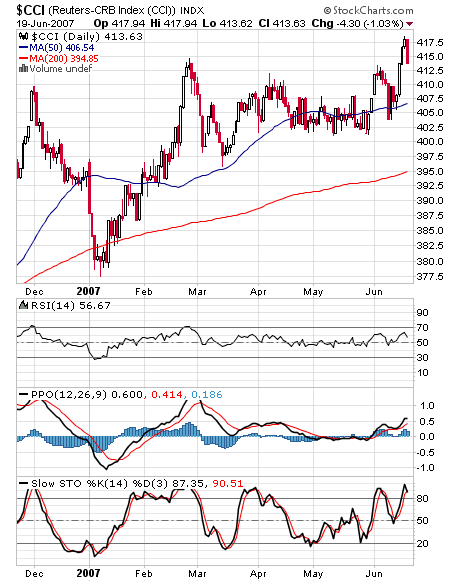


No comments:
Post a Comment