Commodities Charts Homp Page

Friday, July 06, 2007

Copper Inventories

As you probably know low stocks equals less supply and thus the price of copper is normally inversely correlated with LME copper warehouse stocks. The LME copper warehouse stocks level are declining consistently since February 2007, already down 50%. Copper stocks are down from about 200,000 to. 105,475 tonne (July 6).


Technically the copper chart looks fine , a-b-c 3 waves correction then an impulsive rally (wave i) , wave iii is currently underway, PPO , RSI up trending bullish. Potential inverted head shoulders pattern with a price objective of 520.


copper chart

Thursday, June 28, 2007

Tokyo Commodities Exchange to run 24 hours

"Japan’s biggest commodities exchange plans to introduce 24-hour electronic trading. The move by the Tokyo Commodities Exchange is an attempt to attract foreign investors and fend off criticism that it is slowing Tokyo’s drive to become Asia’s leading international financial centre." source

Wednesday, June 20, 2007

CCI Commodities Index

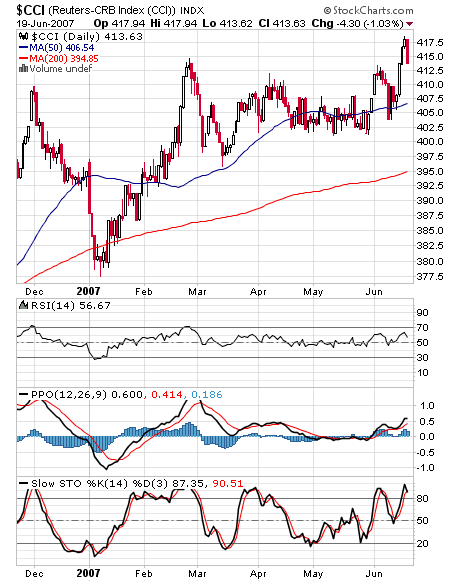
As previously explained, the CCI is the best barometer available for tracking the condition of the general commodities market. The CCI just made a new bull market high. If you are going to trade this index or any of its components be sure to study each of them both fundamentally and technically!

Long term trend support around the 50 weeks moving average.


cci chart

Short term trend line support around 402.

cci chart

Search

Labels