


Thursday, June 28, 2007
Tokyo Commodities Exchange to run 24 hours
"Japan’s biggest commodities exchange plans to introduce 24-hour electronic trading. The move by the Tokyo Commodities Exchange is an attempt to attract foreign investors and fend off criticism that it is slowing Tokyo’s drive to become Asia’s leading international financial centre." source


Wednesday, June 20, 2007
CCI Commodities Index
As previously explained, the CCI is the best barometer available for tracking the condition of the general commodities market. The CCI just made a new bull market high. If you are going to trade this index or any of its components be sure to study each of them both fundamentally and technically!
Long term trend support around the 50 weeks moving average.

Short term trend line support around 402.
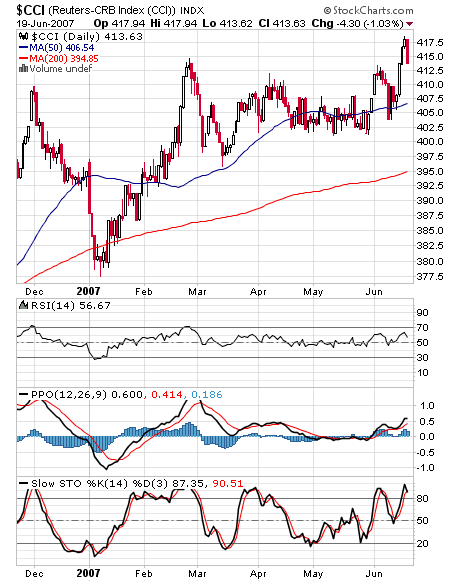
Long term trend support around the 50 weeks moving average.
Short term trend line support around 402.
Thursday, May 24, 2007
Uranium Futures (NYMEX: UX)
Uranium futures contracts are currently available for trading on the New York Mercantile Exchange (NYMEX). The new contract was issued early this month and it is tradable on the CME Globex and Nymex clearport systems.
Specification:
Each contract represents 250 pounds of U308
Tick = 0.05$, tick value = 12.5$
Initial Margin for non members is running around 3375$ per contract.
Financially settled, price is based on the UxC index. – You can trade it but can't get the stuff.
According to the NYMEX data, the front month open interest (June 07) is just 17 contracts, a cold start I must say.
Can you put a channel on this chart?
Uranium chart – 5 years

Support around 105$.
Uranium long term chart (37 years)

Specification:
Each contract represents 250 pounds of U308
Tick = 0.05$, tick value = 12.5$
Initial Margin for non members is running around 3375$ per contract.
Financially settled, price is based on the UxC index. – You can trade it but can't get the stuff.
According to the NYMEX data, the front month open interest (June 07) is just 17 contracts, a cold start I must say.
Can you put a channel on this chart?
Uranium chart – 5 years
Support around 105$.
Uranium long term chart (37 years)
Subscribe to:
Posts (Atom)
