


Wednesday, October 31, 2012
Crude oil prediction and Iran
In case that the Iran situation will escalate in the future and oil export from the Persian gulf is disrupted : The triangle formation will break to the upside and the price of crude oil (wtic cl) will climb to the 210$ area .
Alternative scenario : oil will continue to range under 147$ for many years.


Tuesday, December 02, 2008
CRB Chart
During the last several month commodities had a huge correction . In my opinion - not much downside is left(If any) and speculative shorting should be avoided.
The only question is which commodities are the best buying opportunity?

The only question is which commodities are the best buying opportunity?

Sunday, June 08, 2008
Crude Oil Update
Despite the huge run up for crude oil prices - seen in the last ten years (up more then 1000%) there is no sign that the long term top is in. looking at the long term linear and logarithmic charts below you can see that higher highs are certainly possible.


Obviously anything that goes up can go down but the crude oil market enjoys an ever increasing demand , low above ground inventories / consumption ratio and 100's of millions of consumers that are willing to pay increasing prices at the pump. Currently there are no major reports of immediate oil shortage, the price seems to be the major factor which keeps the supply demand balance in check.
Obviously anything that goes up can go down but the crude oil market enjoys an ever increasing demand , low above ground inventories / consumption ratio and 100's of millions of consumers that are willing to pay increasing prices at the pump. Currently there are no major reports of immediate oil shortage, the price seems to be the major factor which keeps the supply demand balance in check.
Sunday, March 30, 2008
Commodities long term Top ?
In recent years most commodities had a huge run up. The Reuters CRB Continuous Commodity Index climbed more then 200%. By definition as a bull market is maturing there is less and less upward potential. I am sure there are many good reasons for commodities prices to be where they are and the outlook might seems even better but that is usually the case at cyclical top of any bull market.
Bull markets often end in a spectacular rally one in which big profits are made quickly. Have we just seen that?, Is the commodities long term top is in place ?
That's is not my point but the odds for multi month/year correction are certainly increasing.
The CCI index had surely proved itself to be the one index to follow this asset class.


Bull markets often end in a spectacular rally one in which big profits are made quickly. Have we just seen that?, Is the commodities long term top is in place ?
That's is not my point but the odds for multi month/year correction are certainly increasing.
The CCI index had surely proved itself to be the one index to follow this asset class.
Tuesday, January 08, 2008
Palladium
Not all commodities are at new all time highs.
Palladium for example is about 60% below its 2001 highs. This volatile metal was trading anywhere between ~1100$ and less then 100$ over the last 30 years.
There are several ways to invest, trade and speculate in palladium:
1) Physical palladium: Palladium ETF (LSE: PHPD) and palladium maple coins.
2) Palladium derivatives: Futures (Nymex: PA)
3) Palladium mining stocks: SWC, PAL.

Palladium for example is about 60% below its 2001 highs. This volatile metal was trading anywhere between ~1100$ and less then 100$ over the last 30 years.
There are several ways to invest, trade and speculate in palladium:
1) Physical palladium: Palladium ETF (LSE: PHPD) and palladium maple coins.
2) Palladium derivatives: Futures (Nymex: PA)
3) Palladium mining stocks: SWC, PAL.
Friday, August 03, 2007
Commodities exchange to be established in St. Petersburg
Deputy Economic and Trade minister Kirill Androsov said that the international commodities exchange in St. Petersburg will be registered in September or October 2007.
Speaking to journalists in Moscow, Androsov said the exchange would have an initial capital of $US 50 MLN and it would specialise in commodities such as aluminium, timber and metals, and particularly a new Russian export blend crude oil REBCO and oil products.
Leading Russian companies have been invited to participate, with a limit of 10% ownership for founding members.
source
Speaking to journalists in Moscow, Androsov said the exchange would have an initial capital of $US 50 MLN and it would specialise in commodities such as aluminium, timber and metals, and particularly a new Russian export blend crude oil REBCO and oil products.
Leading Russian companies have been invited to participate, with a limit of 10% ownership for founding members.
source
Tuesday, July 24, 2007
Crude Oil update
September Crude Oil (CLU7) bottomed at 54.30$ after topping out at 79.90$.
Still unclear if current level is sustainable.
Resistance between 77$ – 79.90$.
Support between 69$ - 70$.
Crude Oil(CLU7) weekly chart

Still unclear if current level is sustainable.
Resistance between 77$ – 79.90$.
Support between 69$ - 70$.
Crude Oil(CLU7) weekly chart
Monday, July 09, 2007
Platinum, Ready for new highs?
The price of platinum registered a new all time high at May 2006, followed by a three wave correction (A, B, C) . In October 2006 the price bottomed at around 1050$ an ounce and a new rally has begun (primary direction is up so 5 wave pattern is expected). May 2007 another all time new nominal high slightly above 2006 high.
Potential Inverse head and shoulders pattern with 1475$ as initial price objective.

Potential Inverse head and shoulders pattern with 1475$ as initial price objective.
Friday, July 06, 2007
Copper Inventories
As you probably know low stocks equals less supply and thus the price of copper is normally inversely correlated with LME copper warehouse stocks. The LME copper warehouse stocks level are declining consistently since February 2007, already down 50%. Copper stocks are down from about 200,000 to. 105,475 tonne (July 6).
Technically the copper chart looks fine , a-b-c 3 waves correction then an impulsive rally (wave i) , wave iii is currently underway, PPO , RSI up trending bullish. Potential inverted head shoulders pattern with a price objective of 520.

Technically the copper chart looks fine , a-b-c 3 waves correction then an impulsive rally (wave i) , wave iii is currently underway, PPO , RSI up trending bullish. Potential inverted head shoulders pattern with a price objective of 520.
Thursday, June 28, 2007
Tokyo Commodities Exchange to run 24 hours
"Japan’s biggest commodities exchange plans to introduce 24-hour electronic trading. The move by the Tokyo Commodities Exchange is an attempt to attract foreign investors and fend off criticism that it is slowing Tokyo’s drive to become Asia’s leading international financial centre." source
Wednesday, June 20, 2007
CCI Commodities Index
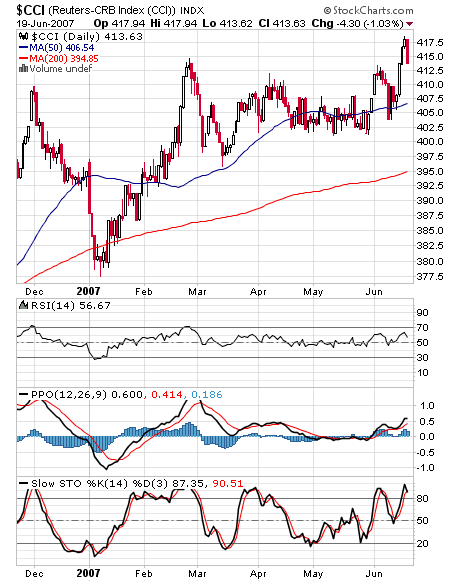
As previously explained, the CCI is the best barometer available for tracking the condition of the general commodities market. The CCI just made a new bull market high. If you are going to trade this index or any of its components be sure to study each of them both fundamentally and technically!
Long term trend support around the 50 weeks moving average.

Short term trend line support around 402.
Long term trend support around the 50 weeks moving average.
Short term trend line support around 402.
Thursday, May 24, 2007
Uranium Futures (NYMEX: UX)
Uranium futures contracts are currently available for trading on the New York Mercantile Exchange (NYMEX). The new contract was issued early this month and it is tradable on the CME Globex and Nymex clearport systems.
Specification:
Each contract represents 250 pounds of U308
Tick = 0.05$, tick value = 12.5$
Initial Margin for non members is running around 3375$ per contract.
Financially settled, price is based on the UxC index. – You can trade it but can't get the stuff.
According to the NYMEX data, the front month open interest (June 07) is just 17 contracts, a cold start I must say.
Can you put a channel on this chart?
Uranium chart – 5 years

Support around 105$.
Uranium long term chart (37 years)

Specification:
Each contract represents 250 pounds of U308
Tick = 0.05$, tick value = 12.5$
Initial Margin for non members is running around 3375$ per contract.
Financially settled, price is based on the UxC index. – You can trade it but can't get the stuff.
According to the NYMEX data, the front month open interest (June 07) is just 17 contracts, a cold start I must say.
Can you put a channel on this chart?
Uranium chart – 5 years
Support around 105$.
Uranium long term chart (37 years)
Saturday, April 28, 2007
Marc Faber Videos
Marc Faber interview on Bloomberg News. Dr. Faber talk about commodities and global markets. (a bit old but still relevant)
Dr. Marc Faber discusses the current world fiscal situation.
Dr. Marc Faber discusses the current world fiscal situation.
Monday, April 23, 2007
LSE Precious Metals ETFs
In addition to the new SWISS Precious Metals ETF's, Five new physical precious metals ETF's are issued on the London Stock Exchange:
Physical Platinum, LSE code: PHPT
Physical Palladium, LSE code: PHPD
Physical Silver, LSE code: PHAG
Physical Gold, LSE code: PHAU
Physical PM Basket, LSE code: PHPM
source
Physical Platinum, LSE code: PHPT
Physical Palladium, LSE code: PHPD
Physical Silver, LSE code: PHAG
Physical Gold, LSE code: PHAU
Physical PM Basket, LSE code: PHPM
source
Wednesday, April 18, 2007
Producers oppose platinum ETF
Normally one would think that a producer would always be happy to see the product price climbing. According to AngloPlat and Impala Platinum this is not the case…
"Trevor Raymond, head of investor relations at AngloPlat, said the world’s largest platinum producer was opposed to against the launch of a platinum as the fund would put upward pressure on prices and would have a negative impact on jewellery demand."
"Bob Gilmour, investor relations manager at Impala Platinum, the world’s second-largest producer, said it was important to retain a sense of perspective about ZKB’s plans as they did not involve a large amount of platinum but cautioned that the timing of the fund’s launch was poor."
-source
"Given the current market conditions, it's probably not the opportune time to launch a product like this because it's just going to put further upward pressure on the price," said Bob Gilmour, manager of investor relations.
"In the longer term, this is not what you want for demand because it causes attempts at substitution."
_source
Producers have been worried about spikes in platinum prices since that increases the threat of possible substitutions being developed for the metal.
-source
Related :
SWISS Platinum, Palladium & Silver ETFs
Platinum ETF ?
"Trevor Raymond, head of investor relations at AngloPlat, said the world’s largest platinum producer was opposed to against the launch of a platinum as the fund would put upward pressure on prices and would have a negative impact on jewellery demand."
"Bob Gilmour, investor relations manager at Impala Platinum, the world’s second-largest producer, said it was important to retain a sense of perspective about ZKB’s plans as they did not involve a large amount of platinum but cautioned that the timing of the fund’s launch was poor."
-source
"Given the current market conditions, it's probably not the opportune time to launch a product like this because it's just going to put further upward pressure on the price," said Bob Gilmour, manager of investor relations.
"In the longer term, this is not what you want for demand because it causes attempts at substitution."
_source
Producers have been worried about spikes in platinum prices since that increases the threat of possible substitutions being developed for the metal.
-source
Related :
SWISS Platinum, Palladium & Silver ETFs
Platinum ETF ?
Monday, April 16, 2007
Platinum, Palladium & Silver ETFs
Last November it was a bad idea now it’s a good one?
Zuercher Kantonalbank, the biggest of Switzerland's 24 government-controlled cantonal lenders, will launch exchange-traded funds (ETFs) for three precious metals, including platinum, after it launched a gold ETF early last year.
The bank plans to list the new ETFs, based on silver, platinum and palladium, on the SWX Swiss Exchange and trading is scheduled to start on May 10, the bank said in a press release on April 13. The new investment products are designed for wealthy private clients and institutional investors, it said. -source
Price wise it seems like none event for now...
Platinum Spot

Palladium Spot

Zuercher Kantonalbank, the biggest of Switzerland's 24 government-controlled cantonal lenders, will launch exchange-traded funds (ETFs) for three precious metals, including platinum, after it launched a gold ETF early last year.
The bank plans to list the new ETFs, based on silver, platinum and palladium, on the SWX Swiss Exchange and trading is scheduled to start on May 10, the bank said in a press release on April 13. The new investment products are designed for wealthy private clients and institutional investors, it said. -source
Price wise it seems like none event for now...
Platinum Spot
Palladium Spot
Sunday, April 15, 2007
WTI Crude Oil Charts
An Uptrend is an uptrend until proven otherwise – when it breaks.
Log vs. Linear charts comparison:
The three years accelerated uptrend was broken on both linear and log charts.
Log Chart: WTI Crude oil broke down from its five years uptrend but currently trades back above the uptrend.

Linear Chart: WTI Crude oil - the five years uptrend stayed intact.

On the weekly CL chart a noticeable uptrend is in progress.

To recap: The price of crude oil recently pulled back significantly. The five years uptrend was damaged. Technical damage requires technical repair, I opine that it will not be easy for crude oil to climb higher. In case of a break below the 2007 low, 40$ remains the long term bearish target.
Related: Crude Oil Gold Ratio
Log vs. Linear charts comparison:
The three years accelerated uptrend was broken on both linear and log charts.
Log Chart: WTI Crude oil broke down from its five years uptrend but currently trades back above the uptrend.
Linear Chart: WTI Crude oil - the five years uptrend stayed intact.
On the weekly CL chart a noticeable uptrend is in progress.
To recap: The price of crude oil recently pulled back significantly. The five years uptrend was damaged. Technical damage requires technical repair, I opine that it will not be easy for crude oil to climb higher. In case of a break below the 2007 low, 40$ remains the long term bearish target.
Related: Crude Oil Gold Ratio
Thursday, April 12, 2007
Commodity ETF , Now In Italy
ETF Securities to launch 31 Exchange Traded Commodities products in Milan
ETF Securities Ltd, which offers investors access to a range of commodities on multiple exchanges, said it is launching 31 exchange traded commodities (ETC) on the Milan stock exchange, following similar launches in Paris, Frankfurt, Amsterdam and London.
On the new listings, head of listings at ETF Securities Nik Bienkowski said: 'We are enabling investors to tap into the ever-increasing appetite for commodities and to trade easily and cheaply on a single platform.'
The launch of the ETCs on Borsa Italiana, where investor demand has prompted the bourse to create a new specific segment on the ETFplus market, will take place next week and comprise 21 individual securities and 10 index securities.
Among the 21 separate classes of commodity securities are aluminium, brent oil, coffee, crude oil, gold and sugar. The baskets of commodities indices include the ETFS Agriculture DJ-AIGCISM, ETFS Energy DJ-AIGCISM as well as ETFS Industrial Metals DJ-AIGCISM.
ETCs, like exchange traded fund (ETFs), enable investors to trade commodities through ordinary brokerage accounts and can be bought and sold the same day by investors on a regulated exchange in the same way as any equity.
Since Sept 2006, ETF Securities said that assets under management on these 31 ETCs have increased by about 200 pct to over 500 mln usd. The rapid growth in assets highlights the investor demand for easy access to new asset classes, it added.
source
ETF Securities Ltd, which offers investors access to a range of commodities on multiple exchanges, said it is launching 31 exchange traded commodities (ETC) on the Milan stock exchange, following similar launches in Paris, Frankfurt, Amsterdam and London.
On the new listings, head of listings at ETF Securities Nik Bienkowski said: 'We are enabling investors to tap into the ever-increasing appetite for commodities and to trade easily and cheaply on a single platform.'
The launch of the ETCs on Borsa Italiana, where investor demand has prompted the bourse to create a new specific segment on the ETFplus market, will take place next week and comprise 21 individual securities and 10 index securities.
Among the 21 separate classes of commodity securities are aluminium, brent oil, coffee, crude oil, gold and sugar. The baskets of commodities indices include the ETFS Agriculture DJ-AIGCISM, ETFS Energy DJ-AIGCISM as well as ETFS Industrial Metals DJ-AIGCISM.
ETCs, like exchange traded fund (ETFs), enable investors to trade commodities through ordinary brokerage accounts and can be bought and sold the same day by investors on a regulated exchange in the same way as any equity.
Since Sept 2006, ETF Securities said that assets under management on these 31 ETCs have increased by about 200 pct to over 500 mln usd. The rapid growth in assets highlights the investor demand for easy access to new asset classes, it added.
source
Monday, April 09, 2007
The CCI Index
For all practical purposes the Continuous Commodity Index (CCI) is the preferred index for tracking the condition of the general commodities market. The reason for that is the way in which this index is calculated – The CCI Methodology.
5.88% for each of the 17 individual commodities included(Energy 17.64% : WTI Crude Oil, Heating Oil, Natural Gas, Grains 17.64% : Corn, Wheat, Soybeans, Livestock 11.76% :
Live Cattle, Lean Hogs, Softs 29.40% : Sugar, Cotton, Coffee, Cocoa, Orange Juice, Metals 23.52% : Gold, Silver, Platinum, Copper)
Here is the explanation of the CCI Methodology from the NYBOT:
The Continuous Commodity Index (CI)is weighted evenly among 17 component commodities. Each weighting is used for both arithmetic averaging of individual commodity months and for geometric averaging of the 17 commodity averages. With equal weighting, no single contract month or commodity has undue impact on the Index. The CCI uses a system of averaging all futures prices six months forward, up to a maximum of five delivery months per commodity. A minimum of two delivery months, however, must be used to calculate the current price if the second contract is outside the six-month window. Contracts in the delivery period are excluded from the calculation. Although each of the 17commodities is equally weighted, the CCI uses an average of the prices of the 17 commodities and an average of those commodities across time within each commodity. Each commodity is arithmetically averaged across time (the six-month window) and then these 17 component figures are geometrically averaged together. The continuous rebalancing provided by this methodology means the Index constantly decreases exposure to commodity markets gaining in value and increases exposure to those markets declining in value.
5.88% for each of the 17 individual commodities included(Energy 17.64% : WTI Crude Oil, Heating Oil, Natural Gas, Grains 17.64% : Corn, Wheat, Soybeans, Livestock 11.76% :
Live Cattle, Lean Hogs, Softs 29.40% : Sugar, Cotton, Coffee, Cocoa, Orange Juice, Metals 23.52% : Gold, Silver, Platinum, Copper)
Here is the explanation of the CCI Methodology from the NYBOT:
The Continuous Commodity Index (CI)is weighted evenly among 17 component commodities. Each weighting is used for both arithmetic averaging of individual commodity months and for geometric averaging of the 17 commodity averages. With equal weighting, no single contract month or commodity has undue impact on the Index. The CCI uses a system of averaging all futures prices six months forward, up to a maximum of five delivery months per commodity. A minimum of two delivery months, however, must be used to calculate the current price if the second contract is outside the six-month window. Contracts in the delivery period are excluded from the calculation. Although each of the 17commodities is equally weighted, the CCI uses an average of the prices of the 17 commodities and an average of those commodities across time within each commodity. Each commodity is arithmetically averaged across time (the six-month window) and then these 17 component figures are geometrically averaged together. The continuous rebalancing provided by this methodology means the Index constantly decreases exposure to commodity markets gaining in value and increases exposure to those markets declining in value.
Saturday, March 17, 2007
Buy & Hold Commodities?
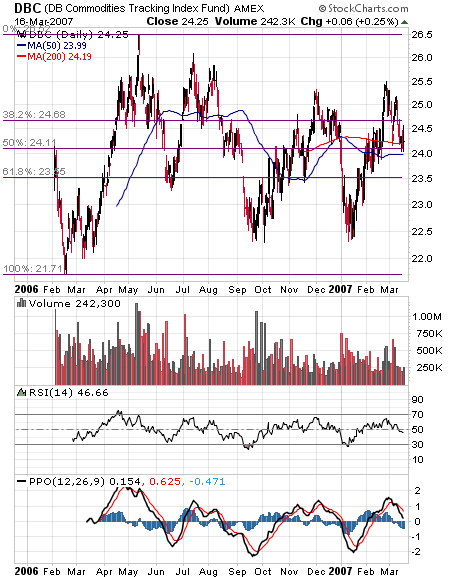
The DBC commodity ETF was listed on the AMEX at early February 2006, interestingly after a little more then a year the thing has gone nowhere!
Anyone who bought the DBC at the IPO has seen little to no returns while at the same time nimble traders had several long & short trading opportunities.
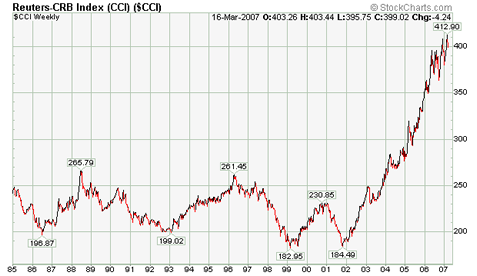
At the same time (February 2006 – March 2007) the CCI which is a broader commodity index have gained around 10%.
That’s made me thinking - Did Deutsche bank picked the wrong commodities?
Technically:
The DBC is near the 50 / 200 Moving averages and the 50% Fibonacci level. RSI is trending down below 50. The PPO is negative but still above the zero line.
CCI(NYBOT) long term chart
Anyone who bought the DBC at the IPO has seen little to no returns while at the same time nimble traders had several long & short trading opportunities.
At the same time (February 2006 – March 2007) the CCI which is a broader commodity index have gained around 10%.
That’s made me thinking - Did Deutsche bank picked the wrong commodities?
Technically:
The DBC is near the 50 / 200 Moving averages and the 50% Fibonacci level. RSI is trending down below 50. The PPO is negative but still above the zero line.
CCI(NYBOT) long term chart
Subscribe to:
Posts (Atom)
